| Param | Original file | Final file |
|---|---|---|
| Filename | modeM0/AS1G04_014T02_9000000232cztM0_level2_bc.evt | modeM0/AS1G04_014T02_9000000232cztM0_level2_quad_clean.evt |
| Size (bytes) | 9,085,777,920 | 3,002,731,200 |
| Size | 8.5 GB | 2.8 GB |
| Events in quadrant A | 109,484,847 | 18,847,423 |
| Events in quadrant B | 51,071,143 | 19,974,686 |
| Events in quadrant C | 42,724,155 | 19,616,806 |
| Events in quadrant D | 58,087,538 | 18,609,588 |
| Mode M9 | |||
|---|---|---|---|
| Quadrant | BADHDUFLAG | Total packets | Discarded packets |
| A | 0 | 255 | 0 |
| B | 0 | 255 | 0 |
| C | 0 | 255 | 0 |
| D | 0 | 255 | 0 |
| Mode SS | |||
|---|---|---|---|
| Quadrant | BADHDUFLAG | Total packets | Discarded packets |
| A | 0 | 4130 | 0 |
| B | 0 | 4130 | 0 |
| C | 0 | 4130 | 0 |
| D | 0 | 4130 | 0 |
| Mode M0 | |||
|---|---|---|---|
| Quadrant | BADHDUFLAG | Total packets | Discarded packets |
| A | 0 | 1117090 | 0 |
| B | 0 | 950869 | 0 |
| C | 0 | 853934 | 0 |
| D | 0 | 880690 | 0 |
| Quadrant | Total seconds | Saturated seconds | Saturation percentage |
|---|---|---|---|
| A | 202853 | 20276 | 9.995415% |
| B | 202853 | 2335 | 1.151080% |
| C | 202853 | 700 | 0.345077% |
| D | 202851 | 10852 | 5.349739% |
Noise dominated data is calculated using 1-second bins in cleaned event files. If a bin has >2000 counts, and if more than 50% of those come from <1% of pixels, then it is considered to be noise-dominated and hence unusable.
| Quadrant | # 1 sec bins | Bins with >0 counts | Bins with >2000 counts | High rate bins dominated by noise | Noise dominated (total time) | Noise dominated (detector-on time) | Marked lightcurve |
|---|---|---|---|---|---|---|---|
| A | 233155 | 202831 | 5132 | 5132 | 2.20% | 2.53% |  |
| B | 233155 | 202842 | 162 | 162 | 0.07% | 0.08% | 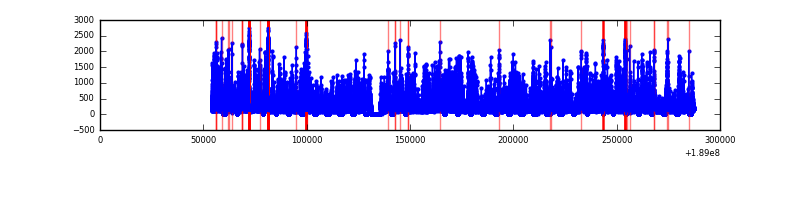 |
| C | 233155 | 202839 | 17 | 17 | 0.01% | 0.01% | 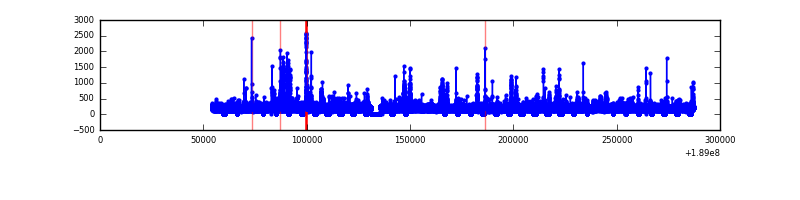 |
| D | 233155 | 202797 | 3400 | 3400 | 1.46% | 1.68% |  |
Top three noisy pixels from each quadrant. If the there are fewer than three noisy pixels in the level2.evt file, extra rows are filled as -1
| Pixel properties | Quadrant properties | ||||||
|---|---|---|---|---|---|---|---|
| Quadrant | DetID | PixID | Counts | Sigma | Mean | Median | Sigma |
| A | 15 | 127 | 61808396 | 34154.7 | 8449 | 8257 | 1809.4 |
| A | 4 | 32 | 11657211 | 6437.96 | 8449 | 8257 | 1809.4 |
| A | 3 | 80 | 969665 | 531.34 | 8449 | 8257 | 1809.4 |
| B | 8 | 4 | 8551377 | 5303.37 | 9008 | 8741 | 1610.8 |
| B | 12 | 52 | 2155480 | 1332.72 | 9008 | 8741 | 1610.8 |
| B | 6 | 53 | 1262960 | 778.63 | 9008 | 8741 | 1610.8 |
| C | 15 | 241 | 6421615 | 3525.77 | 8684 | 8507 | 1818.9 |
| C | 3 | 79 | 649403 | 352.35 | 8684 | 8507 | 1818.9 |
| C | 3 | 111 | 370149 | 198.82 | 8684 | 8507 | 1818.9 |
| D | 13 | 73 | 15732343 | 8573.84 | 8401 | 8133 | 1834.0 |
| D | 9 | 53 | 4390641 | 2389.62 | 8401 | 8133 | 1834.0 |
| D | 2 | 16 | 1760627 | 955.57 | 8401 | 8133 | 1834.0 |
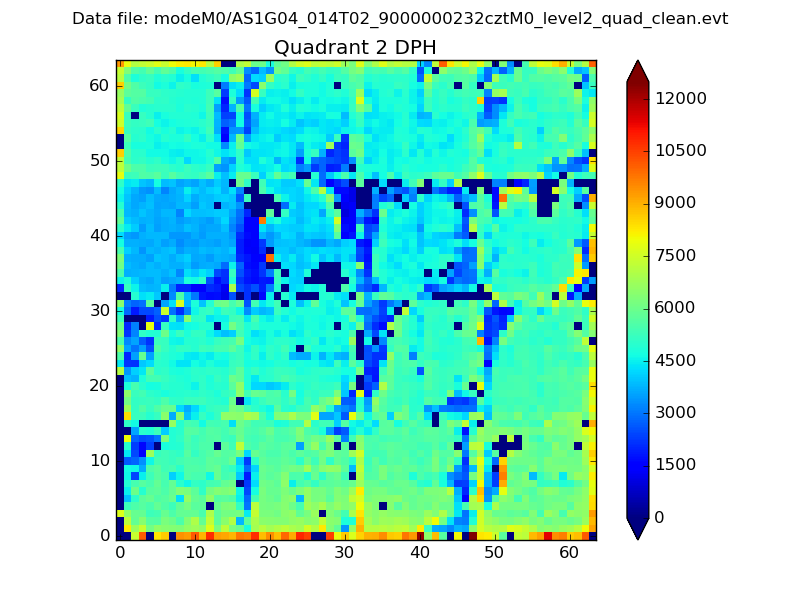
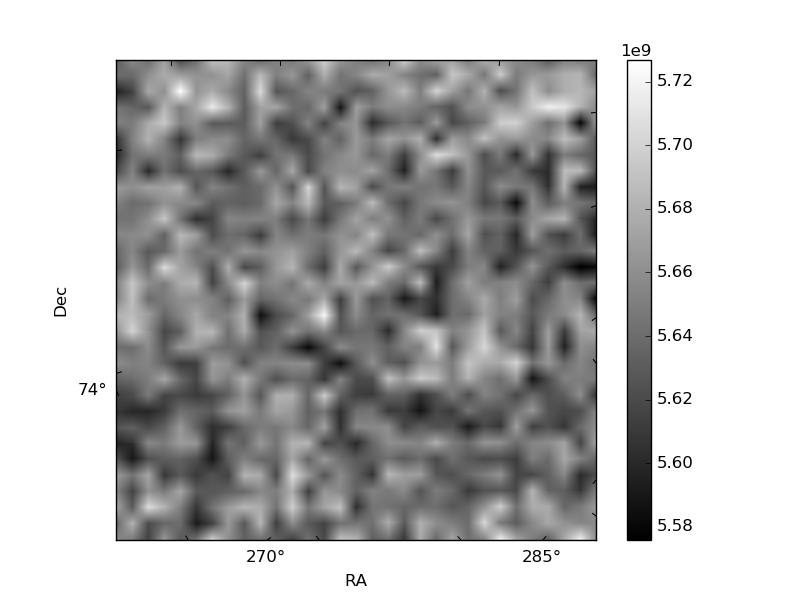
Histogram calculated using DETX and DETY for each event in the final _common_clean file
| Quadrant A |  |
 |
Quadrant B |
|---|---|---|---|
| Quadrant D |  |
 |
Quadrant C |
| Plot type | Count rate plots | Images |
|---|---|---|
| Comparison with Poisson distribution Blue bars denote a histogram of data divided into 1 sec bins. Red curve is a Poisson curve with rate = median count rate of data. |
 |
 |
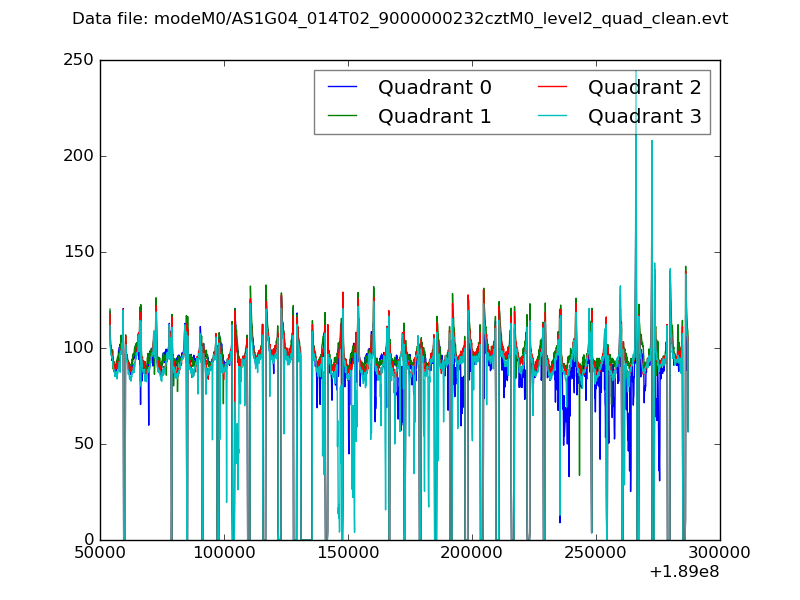
| Quadrant-wise count rates Data is divided into 100 sec bins |
 |
|
| Module-wise count rates for Quadrant A Data is divided into 100 sec bins |
 |
 |
| Module-wise count rates for Quadrant B Data is divided into 100 sec bins |
 |
 |
| Module-wise count rates for Quadrant C Data is divided into 100 sec bins |
 |
 |
| Module-wise count rates for Quadrant D Data is divided into 100 sec bins |
 |
 |
| Parameter | Plot |
|---|---|
| CZT HV Monitor |  |
| D_VDD |  |
| Temperature 1 |  |
| Veto HV Monitor | 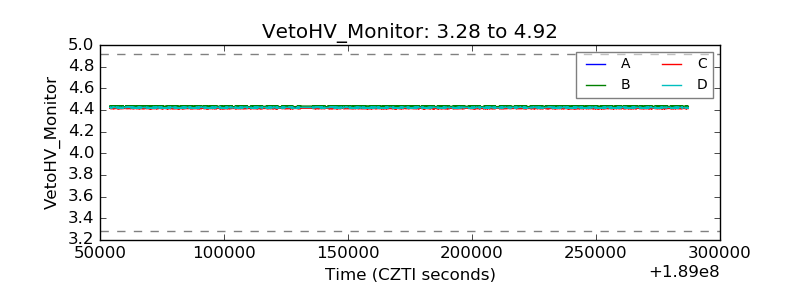 |
| Veto LLD | 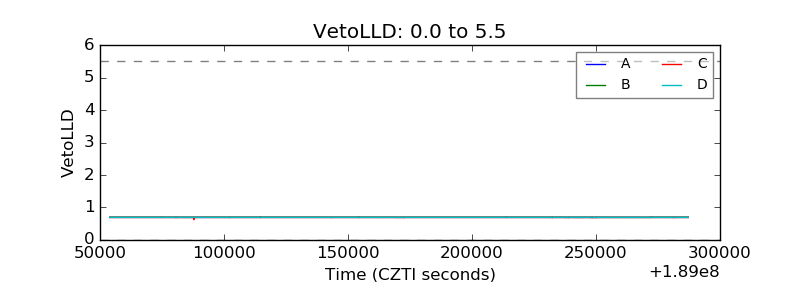 |
| Alpha Counter |  |
| _CPM_Rate |  |
| CZT Counter |  |
| +2.5 Volts monitor |  |
| +5 Volts monitor | 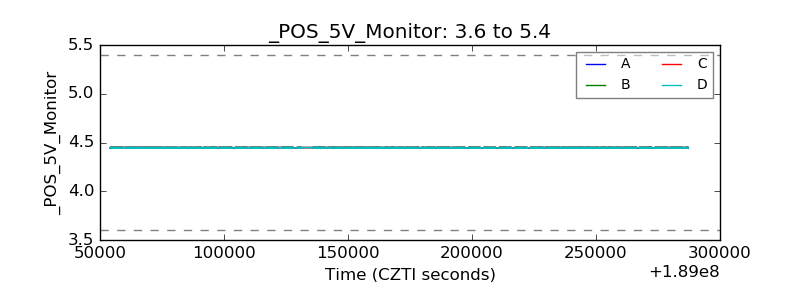 |
| _ROLL_ROT |  |
| _Roll_DEC |  |
| _Roll_RA |  |
| Veto Counter |  |