| Param | Original file | Final file |
|---|---|---|
| Filename | modeM0/AS1G04_002T02_9000000230cztM0_level2_bc.evt | modeM0/AS1G04_002T02_9000000230cztM0_level2_quad_clean.evt |
| Size (bytes) | 16,876,036,800 | 5,642,202,240 |
| Size | 15.7 GB | 5.3 GB |
| Events in quadrant A | 125,347,896 | 36,541,420 |
| Events in quadrant B | 100,307,192 | 37,344,971 |
| Events in quadrant C | 90,070,552 | 36,714,780 |
| Events in quadrant D | 169,569,032 | 34,301,054 |
| Mode SS | |||
|---|---|---|---|
| Quadrant | BADHDUFLAG | Total packets | Discarded packets |
| A | 0 | 7720 | 0 |
| B | 0 | 7720 | 0 |
| C | 0 | 7720 | 0 |
| D | 0 | 7720 | 0 |
| Mode M0 | |||
|---|---|---|---|
| Quadrant | BADHDUFLAG | Total packets | Discarded packets |
| A | 0 | 1806842 | 0 |
| B | 0 | 1790196 | 0 |
| C | 0 | 1618633 | 0 |
| D | 0 | 1981766 | 0 |
| Mode M9 | |||
|---|---|---|---|
| Quadrant | BADHDUFLAG | Total packets | Discarded packets |
| A | 0 | 534 | 0 |
| B | 0 | 534 | 0 |
| C | 0 | 534 | 0 |
| D | 0 | 534 | 0 |
| Quadrant | Total seconds | Saturated seconds | Saturation percentage |
|---|---|---|---|
| A | 379503 | 15884 | 4.185474% |
| B | 379503 | 4136 | 1.089846% |
| C | 379511 | 1325 | 0.349133% |
| D | 379509 | 35499 | 9.353928% |
Noise dominated data is calculated using 1-second bins in cleaned event files. If a bin has >2000 counts, and if more than 50% of those come from <1% of pixels, then it is considered to be noise-dominated and hence unusable.
| Quadrant | # 1 sec bins | Bins with >0 counts | Bins with >2000 counts | High rate bins dominated by noise | Noise dominated (total time) | Noise dominated (detector-on time) | Marked lightcurve |
|---|---|---|---|---|---|---|---|
| A | 437356 | 379487 | 4045 | 4045 | 0.92% | 1.07% | 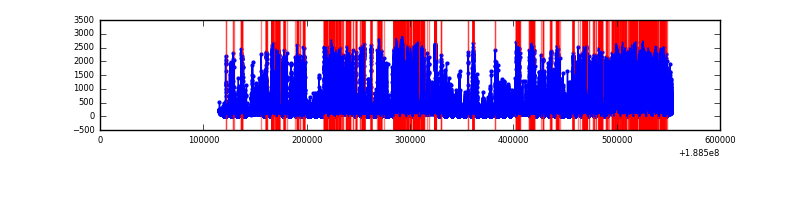 |
| B | 437356 | 379499 | 157 | 157 | 0.04% | 0.04% |  |
| C | 437356 | 379507 | 115 | 115 | 0.03% | 0.03% |  |
| D | 437356 | 379477 | 2045 | 2045 | 0.47% | 0.54% |  |
Top three noisy pixels from each quadrant. If the there are fewer than three noisy pixels in the level2.evt file, extra rows are filled as -1
| Pixel properties | Quadrant properties | ||||||
|---|---|---|---|---|---|---|---|
| Quadrant | DetID | PixID | Counts | Sigma | Mean | Median | Sigma |
| A | 15 | 127 | 31307440 | 9095.66 | 16264 | 15888 | 3440.3 |
| A | 4 | 32 | 27259975 | 7919.16 | 16264 | 15888 | 3440.3 |
| A | 0 | 128 | 691550 | 196.4 | 16264 | 15888 | 3440.3 |
| B | 8 | 4 | 18666718 | 6188.44 | 16869 | 16364 | 3013.7 |
| B | 12 | 52 | 3157548 | 1042.29 | 16869 | 16364 | 3013.7 |
| B | 6 | 53 | 2904596 | 958.35 | 16869 | 16364 | 3013.7 |
| C | 15 | 241 | 16204166 | 4779.85 | 16230 | 15922 | 3386.8 |
| C | 3 | 9 | 4909127 | 1444.8 | 16230 | 15922 | 3386.8 |
| C | 3 | 79 | 1353523 | 394.95 | 16230 | 15922 | 3386.8 |
| D | 13 | 169 | 73025666 | 21689.93 | 15566 | 15107 | 3366.1 |
| D | 10 | 84 | 14559271 | 4320.77 | 15566 | 15107 | 3366.1 |
| D | 12 | 22 | 8237778 | 2442.79 | 15566 | 15107 | 3366.1 |
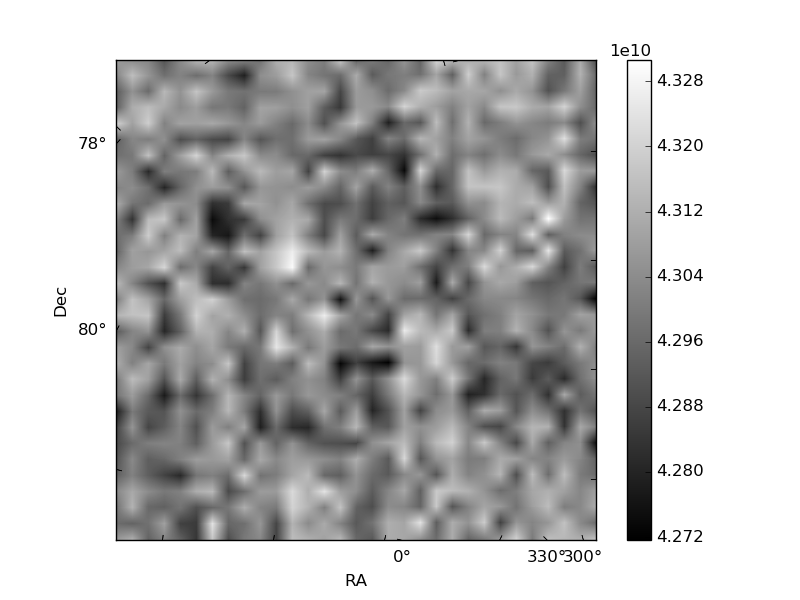
Histogram calculated using DETX and DETY for each event in the final _common_clean file
| Quadrant A |  |
 |
Quadrant B |
|---|---|---|---|
| Quadrant D |  |
 |
Quadrant C |
| Plot type | Count rate plots | Images |
|---|---|---|
| Comparison with Poisson distribution Blue bars denote a histogram of data divided into 1 sec bins. Red curve is a Poisson curve with rate = median count rate of data. |
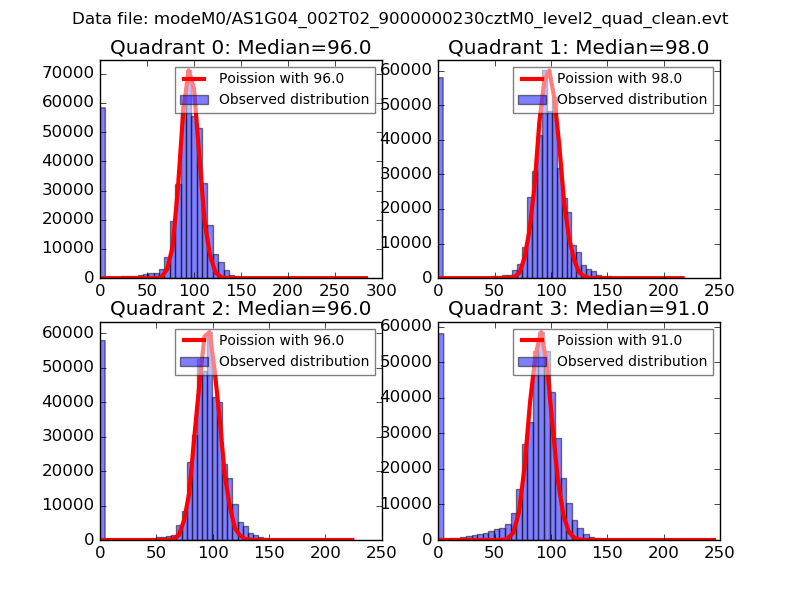 |
 |
| Quadrant-wise count rates Data is divided into 100 sec bins |
 |
|
| Module-wise count rates for Quadrant A Data is divided into 100 sec bins |
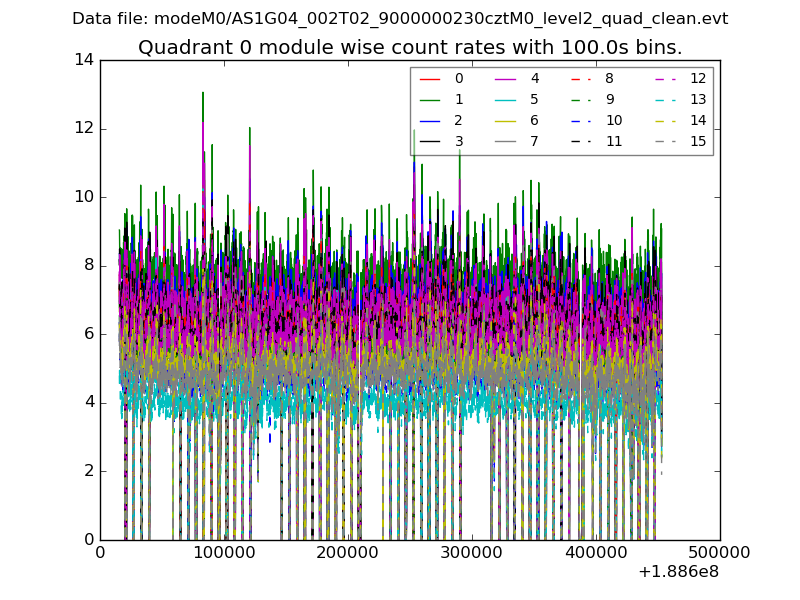 |
 |
| Module-wise count rates for Quadrant B Data is divided into 100 sec bins |
 |
 |
| Module-wise count rates for Quadrant C Data is divided into 100 sec bins |
 |
 |
| Module-wise count rates for Quadrant D Data is divided into 100 sec bins |
 |
 |
| Parameter | Plot |
|---|---|
| CZT HV Monitor |  |
| D_VDD |  |
| Temperature 1 |  |
| Veto HV Monitor |  |
| Veto LLD |  |
| Alpha Counter |  |
| _CPM_Rate |  |
| CZT Counter |  |
| +2.5 Volts monitor |  |
| +5 Volts monitor | 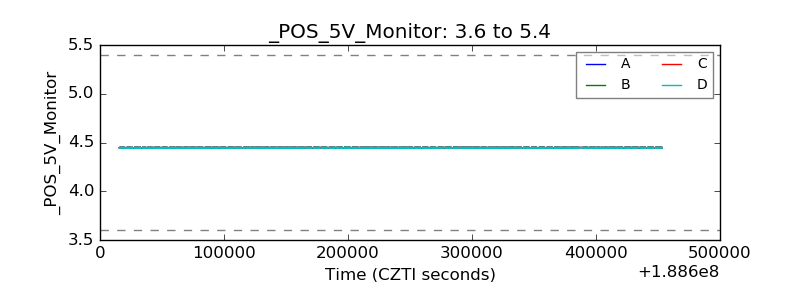 |
| Veto Counter |  |