| Param | Original file | Final file |
|---|---|---|
| Filename | modeM0/AS1G04_003T02_9000000228cztM0_level2_bc.evt | modeM0/AS1G04_003T02_9000000228cztM0_level2_quad_clean.evt |
| Size (bytes) | 688,216,320 | 203,250,240 |
| Size | 656.3 MB | 193.8 MB |
| Events in quadrant A | 2,409,844 | 1,348,803 |
| Events in quadrant B | 3,244,723 | 1,354,205 |
| Events in quadrant C | 3,424,047 | 1,342,432 |
| Events in quadrant D | 10,827,397 | 1,165,454 |
| Mode M9 | |||
|---|---|---|---|
| Quadrant | BADHDUFLAG | Total packets | Discarded packets |
| A | 0 | 32 | 0 |
| B | 0 | 32 | 0 |
| C | 0 | 32 | 0 |
| D | 0 | 32 | 0 |
| Mode M0 | |||
|---|---|---|---|
| Quadrant | BADHDUFLAG | Total packets | Discarded packets |
| A | 0 | 55723 | 0 |
| B | 0 | 61428 | 0 |
| C | 0 | 57561 | 0 |
| D | 0 | 99110 | 0 |
| Mode SS | |||
|---|---|---|---|
| Quadrant | BADHDUFLAG | Total packets | Discarded packets |
| A | 0 | 282 | 0 |
| B | 0 | 282 | 0 |
| C | 0 | 282 | 0 |
| D | 0 | 282 | 0 |
| Quadrant | Total seconds | Saturated seconds | Saturation percentage |
|---|---|---|---|
| A | 13661 | 5 | 0.036601% |
| B | 13661 | 82 | 0.600249% |
| C | 13661 | 36 | 0.263524% |
| D | 13661 | 2850 | 20.862309% |
Noise dominated data is calculated using 1-second bins in cleaned event files. If a bin has >2000 counts, and if more than 50% of those come from <1% of pixels, then it is considered to be noise-dominated and hence unusable.
| Quadrant | # 1 sec bins | Bins with >0 counts | Bins with >2000 counts | High rate bins dominated by noise | Noise dominated (total time) | Noise dominated (detector-on time) | Marked lightcurve |
|---|---|---|---|---|---|---|---|
| A | 16966 | 13661 | 0 | 0 | 0.00% | 0.00% |  |
| B | 16966 | 13660 | 4 | 4 | 0.02% | 0.03% |  |
| C | 16966 | 13658 | 0 | 0 | 0.00% | 0.00% | 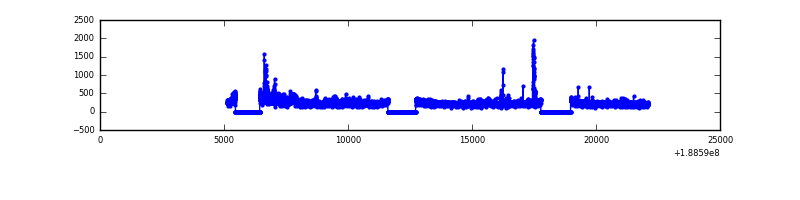 |
| D | 16966 | 13658 | 8 | 8 | 0.05% | 0.06% |  |
Top three noisy pixels from each quadrant. If the there are fewer than three noisy pixels in the level2.evt file, extra rows are filled as -1
| Pixel properties | Quadrant properties | ||||||
|---|---|---|---|---|---|---|---|
| Quadrant | DetID | PixID | Counts | Sigma | Mean | Median | Sigma |
| A | 12 | 243 | 30812 | 232.55 | 611 | 599 | 129.9 |
| A | 13 | 9 | 12627 | 92.58 | 611 | 599 | 129.9 |
| A | 13 | 235 | 8289 | 59.19 | 611 | 599 | 129.9 |
| B | 8 | 4 | 424483 | 3774.02 | 623 | 605 | 112.3 |
| B | 6 | 53 | 123560 | 1094.74 | 623 | 605 | 112.3 |
| B | 12 | 52 | 114186 | 1011.27 | 623 | 605 | 112.3 |
| C | 15 | 241 | 645637 | 5031.9 | 603 | 592 | 128.2 |
| C | 8 | 208 | 261085 | 2032.07 | 603 | 592 | 128.2 |
| C | 9 | 52 | 48354 | 372.58 | 603 | 592 | 128.2 |
| D | 13 | 169 | 6560656 | 54518.0 | 541 | 526 | 120.3 |
| D | 10 | 84 | 1460629 | 12134.19 | 541 | 526 | 120.3 |
| D | 12 | 22 | 229142 | 1899.91 | 541 | 526 | 120.3 |
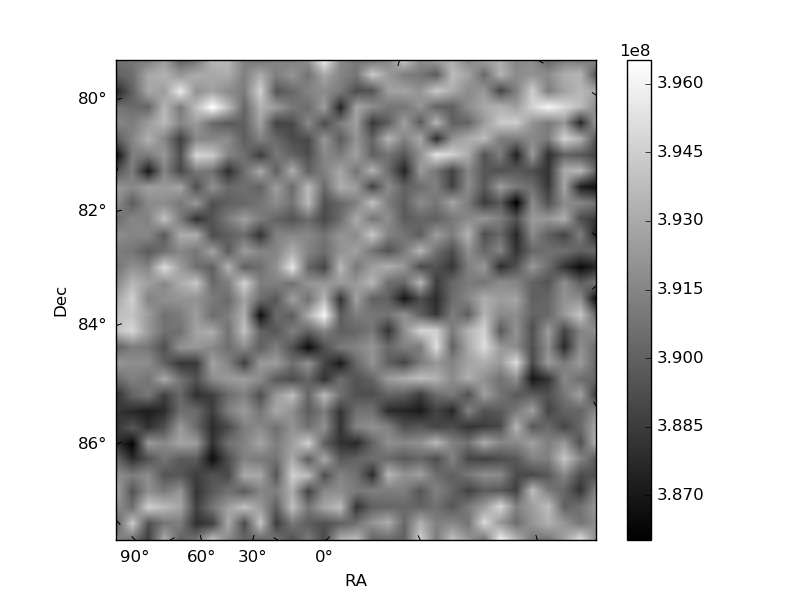
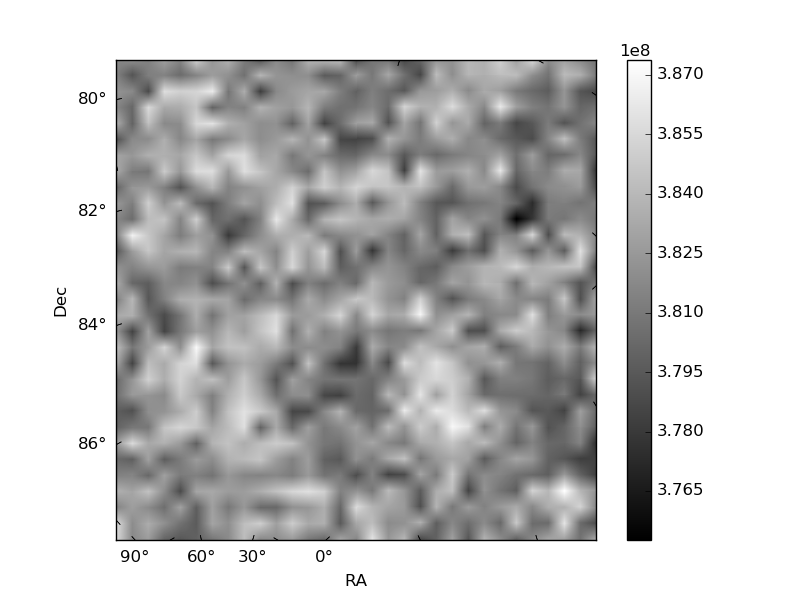
Histogram calculated using DETX and DETY for each event in the final _common_clean file
| Quadrant A |  |
 |
Quadrant B |
|---|---|---|---|
| Quadrant D |  |
 |
Quadrant C |
| Plot type | Count rate plots | Images |
|---|---|---|
| Comparison with Poisson distribution Blue bars denote a histogram of data divided into 1 sec bins. Red curve is a Poisson curve with rate = median count rate of data. |
 |
 |
| Quadrant-wise count rates Data is divided into 100 sec bins |
 |
|
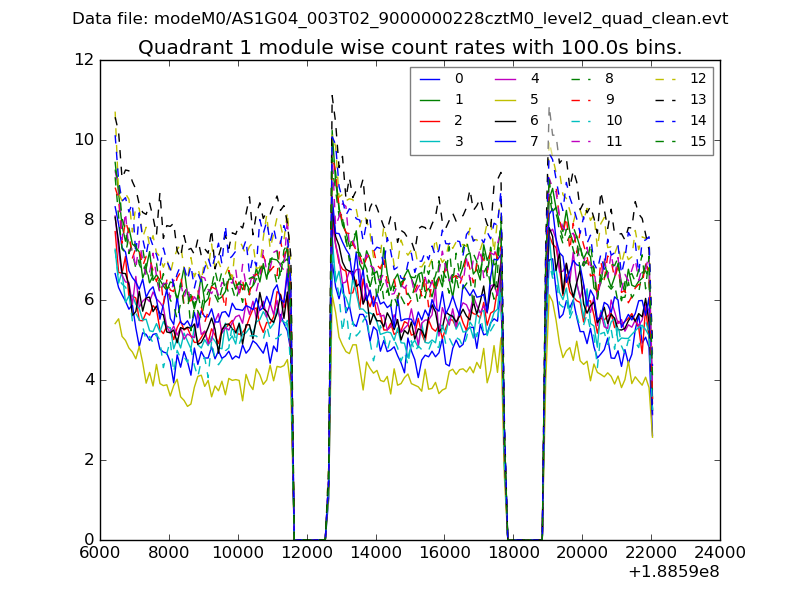
| Module-wise count rates for Quadrant A Data is divided into 100 sec bins |
 |
 |
| Module-wise count rates for Quadrant B Data is divided into 100 sec bins |
 |
 |
| Module-wise count rates for Quadrant C Data is divided into 100 sec bins |
 |
 |
| Module-wise count rates for Quadrant D Data is divided into 100 sec bins |
 |
 |
| Parameter | Plot |
|---|---|
| CZT HV Monitor |  |
| D_VDD | 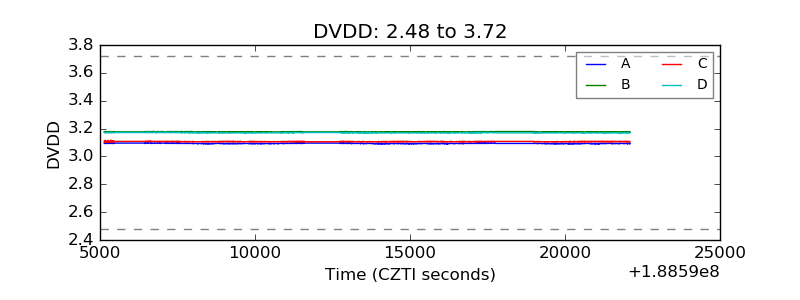 |
| Temperature 1 | 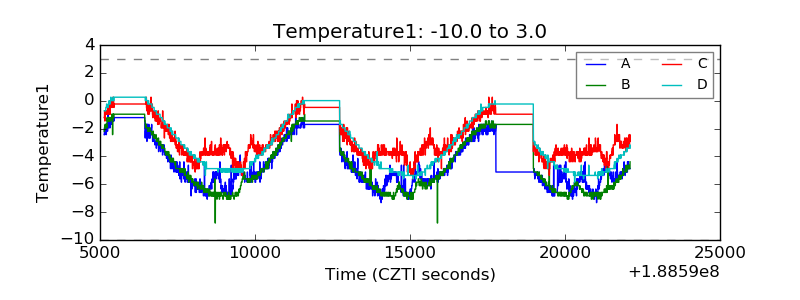 |
| Veto HV Monitor |  |
| Veto LLD |  |
| Alpha Counter |  |
| _CPM_Rate |  |
| CZT Counter |  |
| +2.5 Volts monitor |  |
| +5 Volts monitor |  |
| _ROLL_ROT |  |
| _Roll_DEC | 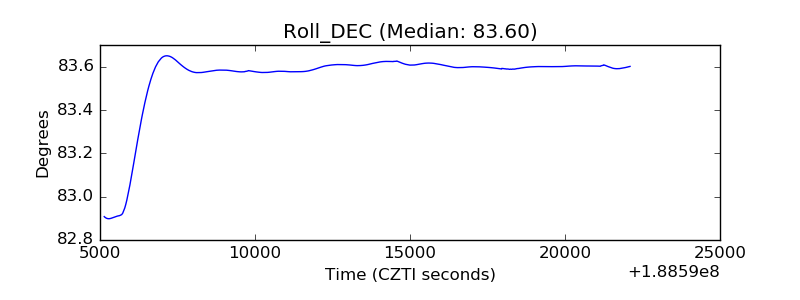 |
| _Roll_RA |  |
| Veto Counter |  |