| Param | Original file | Final file |
|---|---|---|
| Filename | modeM0/AS1G04_011T02_9000000226cztM0_level2_bc.evt | modeM0/AS1G04_011T02_9000000226cztM0_level2_quad_clean.evt |
| Size (bytes) | 13,725,843,840 | 3,649,564,800 |
| Size | 12.8 GB | 3.4 GB |
| Events in quadrant A | 54,188,826 | 25,245,176 |
| Events in quadrant B | 130,285,882 | 22,329,151 |
| Events in quadrant C | 61,818,039 | 24,673,536 |
| Events in quadrant D | 152,468,480 | 21,221,945 |
| Mode SS | |||
|---|---|---|---|
| Quadrant | BADHDUFLAG | Total packets | Discarded packets |
| A | 0 | 5048 | 0 |
| B | 0 | 5052 | 0 |
| C | 0 | 5048 | 0 |
| D | 0 | 5048 | 0 |
| Mode M9 | |||
|---|---|---|---|
| Quadrant | BADHDUFLAG | Total packets | Discarded packets |
| A | 0 | 302 | 0 |
| B | 0 | 301 | 0 |
| C | 0 | 301 | 0 |
| D | 0 | 301 | 0 |
| Mode M0 | |||
|---|---|---|---|
| Quadrant | BADHDUFLAG | Total packets | Discarded packets |
| A | 0 | 1094111 | 0 |
| B | 0 | 1489709 | 0 |
| C | 0 | 1088556 | 0 |
| D | 0 | 1570447 | 0 |
| Quadrant | Total seconds | Saturated seconds | Saturation percentage |
|---|---|---|---|
| A | 248763 | 1892 | 0.760563% |
| B | 248743 | 46412 | 18.658616% |
| C | 248758 | 1276 | 0.512948% |
| D | 248468 | 59402 | 23.907304% |
Noise dominated data is calculated using 1-second bins in cleaned event files. If a bin has >2000 counts, and if more than 50% of those come from <1% of pixels, then it is considered to be noise-dominated and hence unusable.
| Quadrant | # 1 sec bins | Bins with >0 counts | Bins with >2000 counts | High rate bins dominated by noise | Noise dominated (total time) | Noise dominated (detector-on time) | Marked lightcurve |
|---|---|---|---|---|---|---|---|
| A | 285064 | 248791 | 441 | 441 | 0.15% | 0.18% |  |
| B | 285064 | 248755 | 1763 | 1763 | 0.62% | 0.71% |  |
| C | 285064 | 248798 | 38 | 38 | 0.01% | 0.02% |  |
| D | 285063 | 248500 | 4335 | 4335 | 1.52% | 1.74% |  |
Top three noisy pixels from each quadrant. If the there are fewer than three noisy pixels in the level2.evt file, extra rows are filled as -1
| Pixel properties | Quadrant properties | ||||||
|---|---|---|---|---|---|---|---|
| Quadrant | DetID | PixID | Counts | Sigma | Mean | Median | Sigma |
| A | 3 | 80 | 4800244 | 1991.68 | 11306 | 11062 | 2404.6 |
| A | 4 | 32 | 2787719 | 1154.73 | 11306 | 11062 | 2404.6 |
| A | 8 | 14 | 924538 | 379.89 | 11306 | 11062 | 2404.6 |
| B | 2 | 32 | 68700606 | 37111.16 | 10255 | 9939 | 1850.9 |
| B | 8 | 4 | 10110176 | 5456.8 | 10255 | 9939 | 1850.9 |
| B | 5 | 191 | 2782466 | 1497.9 | 10255 | 9939 | 1850.9 |
| C | 15 | 241 | 11504730 | 4937.91 | 10987 | 10781 | 2327.7 |
| C | 8 | 208 | 2802986 | 1199.56 | 10987 | 10781 | 2327.7 |
| C | 9 | 52 | 1789895 | 764.32 | 10987 | 10781 | 2327.7 |
| D | 13 | 169 | 61673446 | 28446.04 | 9807 | 9497 | 2167.8 |
| D | 12 | 22 | 23015455 | 10612.82 | 9807 | 9497 | 2167.8 |
| D | 10 | 84 | 16792027 | 7741.9 | 9807 | 9497 | 2167.8 |
Histogram calculated using DETX and DETY for each event in the final _common_clean file
| Quadrant A |  |
 |
Quadrant B |
|---|---|---|---|
| Quadrant D |  |
 |
Quadrant C |
| Plot type | Count rate plots | Images |
|---|---|---|
| Comparison with Poisson distribution Blue bars denote a histogram of data divided into 1 sec bins. Red curve is a Poisson curve with rate = median count rate of data. |
 |
 |
| Quadrant-wise count rates Data is divided into 100 sec bins |
 |
|
| Module-wise count rates for Quadrant A Data is divided into 100 sec bins |
 |
 |
| Module-wise count rates for Quadrant B Data is divided into 100 sec bins |
 |
 |
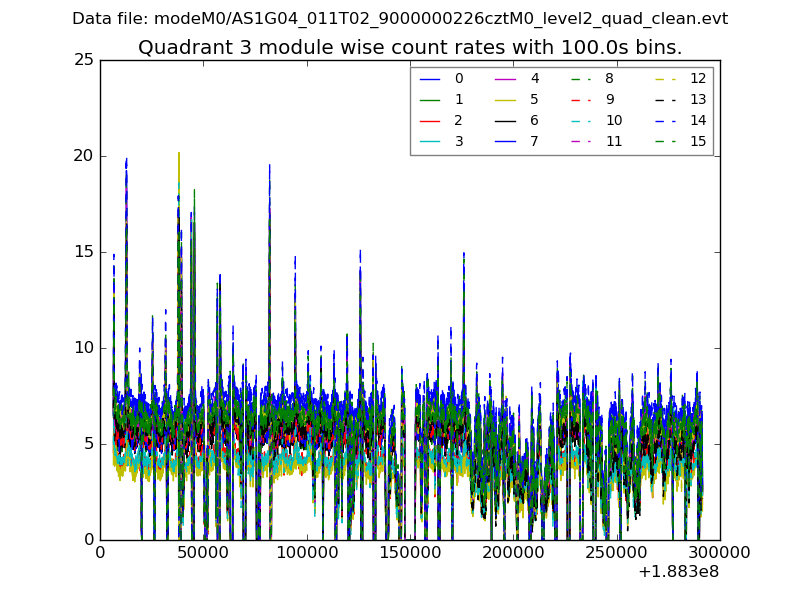
| Module-wise count rates for Quadrant C Data is divided into 100 sec bins |
 |
 |
| Module-wise count rates for Quadrant D Data is divided into 100 sec bins |
 |
 |
| Parameter | Plot |
|---|---|
| CZT HV Monitor |  |
| D_VDD | 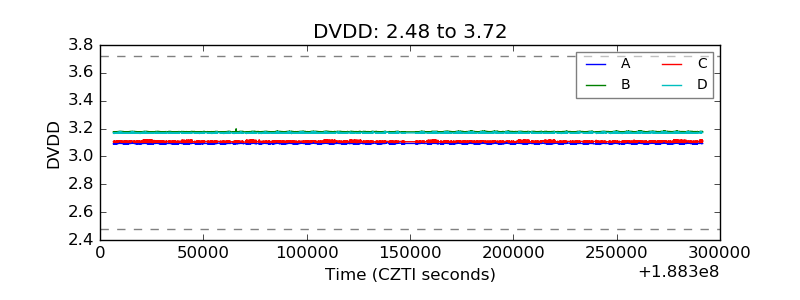 |
| Temperature 1 |  |
| Veto HV Monitor |  |
| Veto LLD |  |
| Alpha Counter | 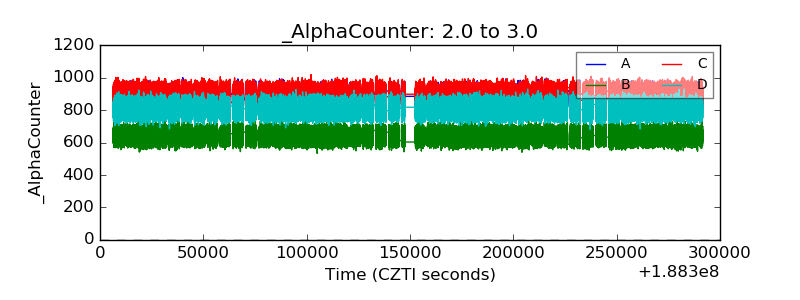 |
| _CPM_Rate |  |
| CZT Counter | 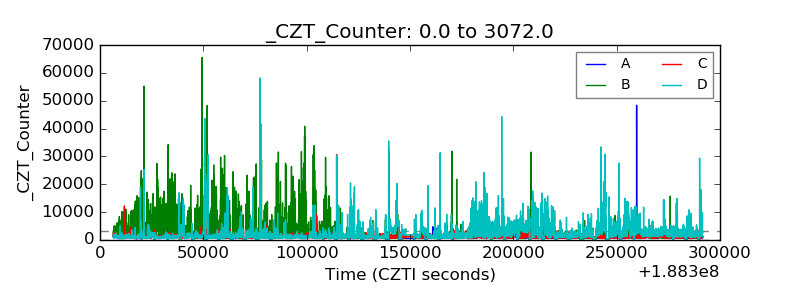 |
| +2.5 Volts monitor | 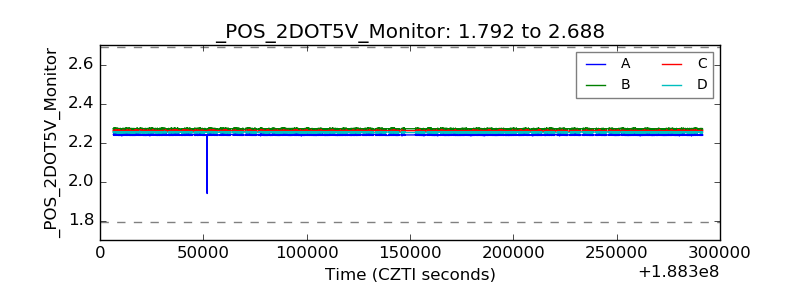 |
| +5 Volts monitor |  |
| Veto Counter |  |