| Param | Original file | Final file |
|---|---|---|
| Filename | modeM0/AS1G04_003T02_9000000224cztM0_level2_bc.evt | modeM0/AS1G04_003T02_9000000224cztM0_level2_quad_clean.evt |
| Size (bytes) | 1,006,329,600 | 448,824,960 |
| Size | 959.7 MB | 428.0 MB |
| Events in quadrant A | 5,478,591 | 2,981,379 |
| Events in quadrant B | 6,046,623 | 2,995,336 |
| Events in quadrant C | 6,739,876 | 2,871,421 |
| Events in quadrant D | 10,221,550 | 2,744,869 |
| Mode SS | |||
|---|---|---|---|
| Quadrant | BADHDUFLAG | Total packets | Discarded packets |
| A | 0 | 590 | 0 |
| B | 0 | 590 | 0 |
| C | 0 | 590 | 0 |
| D | 0 | 590 | 0 |
| Mode M0 | |||
|---|---|---|---|
| Quadrant | BADHDUFLAG | Total packets | Discarded packets |
| A | 0 | 123916 | 0 |
| B | 0 | 128231 | 0 |
| C | 0 | 122601 | 0 |
| D | 0 | 128420 | 0 |
| Mode M9 | |||
|---|---|---|---|
| Quadrant | BADHDUFLAG | Total packets | Discarded packets |
| A | 0 | 52 | 0 |
| B | 0 | 52 | 0 |
| C | 0 | 52 | 0 |
| D | 0 | 52 | 0 |
| Quadrant | Total seconds | Saturated seconds | Saturation percentage |
|---|---|---|---|
| A | 29130 | 174 | 0.597322% |
| B | 29130 | 186 | 0.638517% |
| C | 29130 | 109 | 0.374185% |
| D | 29128 | 1527 | 5.242378% |
Noise dominated data is calculated using 1-second bins in cleaned event files. If a bin has >2000 counts, and if more than 50% of those come from <1% of pixels, then it is considered to be noise-dominated and hence unusable.
| Quadrant | # 1 sec bins | Bins with >0 counts | Bins with >2000 counts | High rate bins dominated by noise | Noise dominated (total time) | Noise dominated (detector-on time) | Marked lightcurve |
|---|---|---|---|---|---|---|---|
| A | 34206 | 29128 | 14 | 14 | 0.04% | 0.05% |  |
| B | 34206 | 29130 | 7 | 7 | 0.02% | 0.02% |  |
| C | 34206 | 29129 | 8 | 8 | 0.02% | 0.03% |  |
| D | 34206 | 29128 | 885 | 885 | 2.59% | 3.04% |  |
Top three noisy pixels from each quadrant. If the there are fewer than three noisy pixels in the level2.evt file, extra rows are filled as -1
| Pixel properties | Quadrant properties | ||||||
|---|---|---|---|---|---|---|---|
| Quadrant | DetID | PixID | Counts | Sigma | Mean | Median | Sigma |
| A | 3 | 80 | 143940 | 521.48 | 1314 | 1289 | 273.5 |
| A | 12 | 133 | 124454 | 450.25 | 1314 | 1289 | 273.5 |
| A | 12 | 243 | 90187 | 324.98 | 1314 | 1289 | 273.5 |
| B | 5 | 191 | 276031 | 1148.06 | 1340 | 1303 | 239.3 |
| B | 15 | 22 | 158865 | 658.43 | 1340 | 1303 | 239.3 |
| B | 6 | 53 | 139528 | 577.63 | 1340 | 1303 | 239.3 |
| C | 15 | 241 | 1474432 | 5627.57 | 1263 | 1242 | 261.8 |
| C | 3 | 79 | 87395 | 329.1 | 1263 | 1242 | 261.8 |
| C | 10 | 19 | 84261 | 317.13 | 1263 | 1242 | 261.8 |
| D | 12 | 22 | 4330214 | 16339.41 | 1239 | 1205 | 264.9 |
| D | 1 | 239 | 400871 | 1508.5 | 1239 | 1205 | 264.9 |
| D | 6 | 6 | 304492 | 1144.73 | 1239 | 1205 | 264.9 |
Histogram calculated using DETX and DETY for each event in the final _common_clean file
| Quadrant A |  |
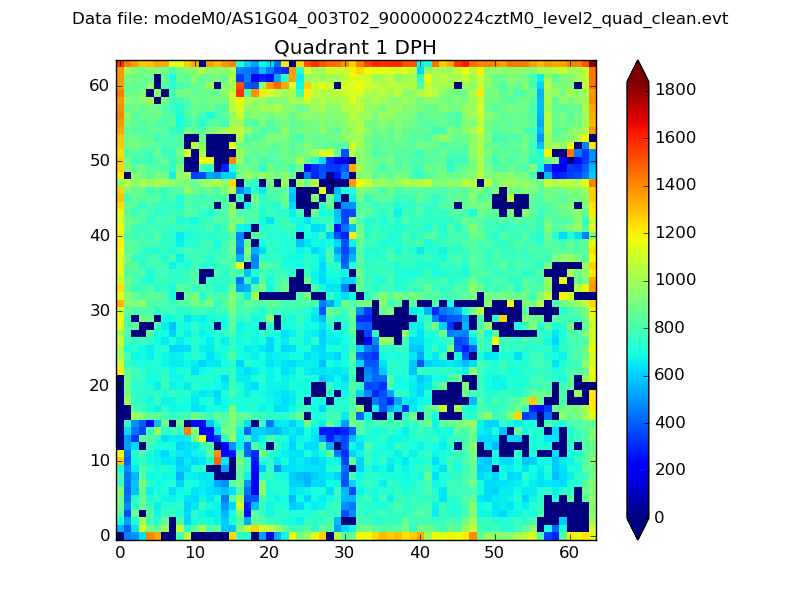 |
Quadrant B |
|---|---|---|---|
| Quadrant D |  |
 |
Quadrant C |
| Plot type | Count rate plots | Images |
|---|---|---|
| Comparison with Poisson distribution Blue bars denote a histogram of data divided into 1 sec bins. Red curve is a Poisson curve with rate = median count rate of data. |
 |
 |
| Quadrant-wise count rates Data is divided into 100 sec bins |
 |
|
| Module-wise count rates for Quadrant A Data is divided into 100 sec bins |
 |
 |
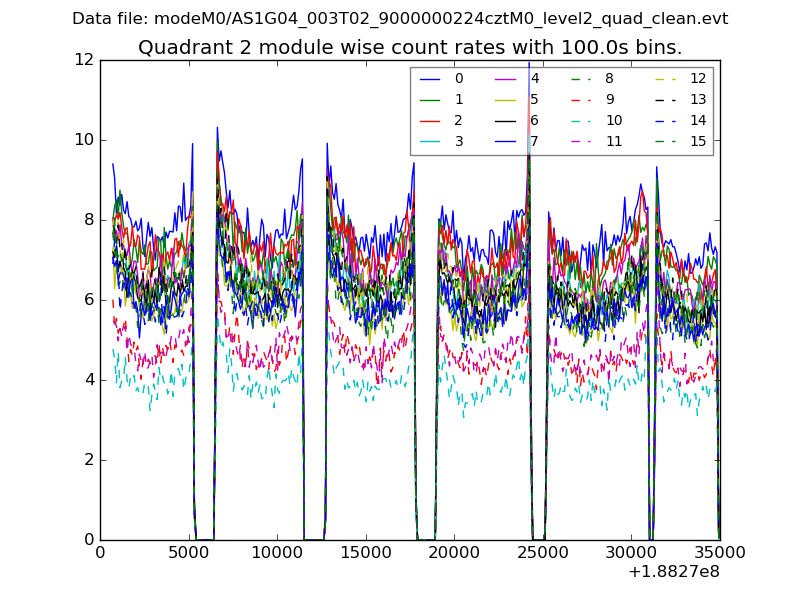
| Module-wise count rates for Quadrant B Data is divided into 100 sec bins |
 |
 |
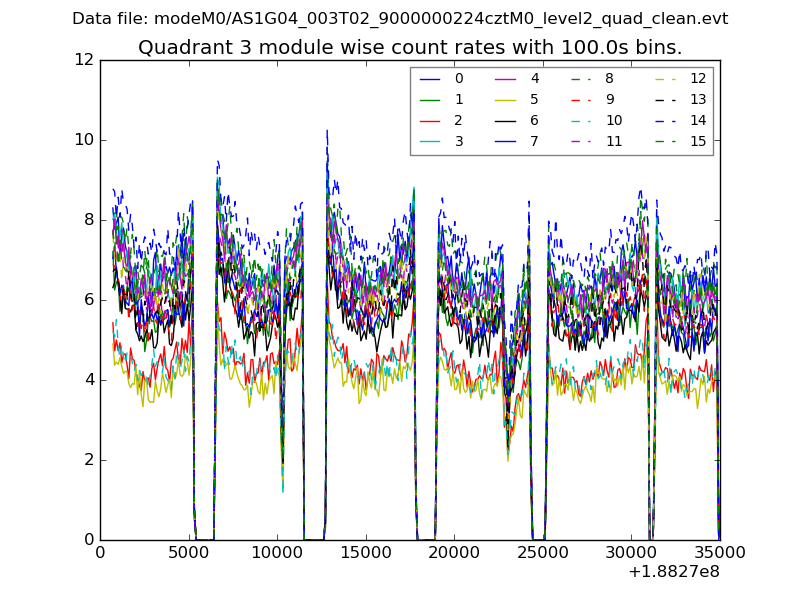
| Module-wise count rates for Quadrant C Data is divided into 100 sec bins |
 |
 |
| Module-wise count rates for Quadrant D Data is divided into 100 sec bins |
 |
 |
| Parameter | Plot |
|---|---|
| CZT HV Monitor |  |
| D_VDD |  |
| Temperature 1 | 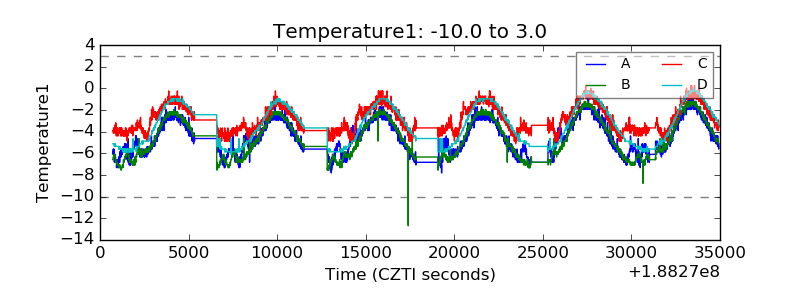 |
| Veto HV Monitor | 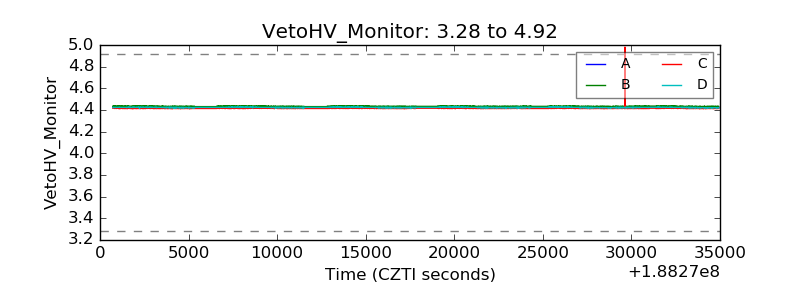 |
| Veto LLD |  |
| Alpha Counter |  |
| _CPM_Rate | 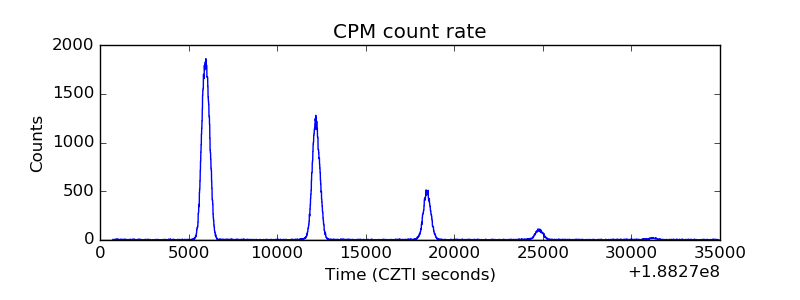 |
| CZT Counter |  |
| +2.5 Volts monitor |  |
| +5 Volts monitor | 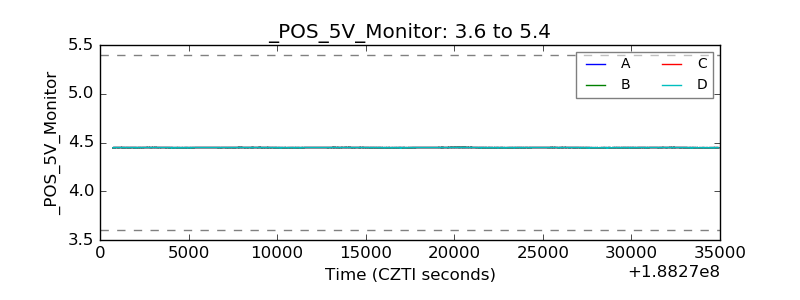 |
| _ROLL_ROT | 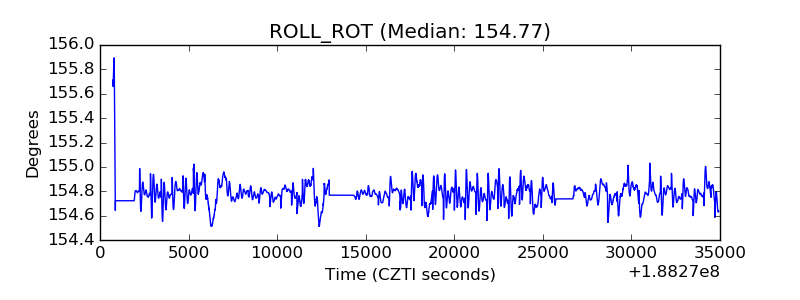 |
| _Roll_DEC |  |
| _Roll_RA |  |
| Veto Counter |  |