| Param | Original file | Final file |
|---|---|---|
| Filename | modeM0/AS1G04_003T01_9000000222cztM0_level2.evt | modeM0/AS1G04_003T01_9000000222cztM0_level2_quad_clean.evt |
| Size (bytes) | 1,657,771,200 | 176,817,600 |
| Size | 1.5 GB | 168.6 MB |
| Events in quadrant A | 12,288,606 | 1,176,422 |
| Events in quadrant B | 12,972,399 | 1,190,971 |
| Events in quadrant C | 12,151,208 | 1,156,233 |
| Events in quadrant D | 12,112,555 | 1,118,496 |
| Mode SS | |||
|---|---|---|---|
| Quadrant | BADHDUFLAG | Total packets | Discarded packets |
| A | 0 | 210 | 0 |
| B | 0 | 212 | 0 |
| C | 0 | 212 | 0 |
| D | 0 | 212 | 0 |
| Mode M0 | |||
|---|---|---|---|
| Quadrant | BADHDUFLAG | Total packets | Discarded packets |
| A | 0 | 43817 | 0 |
| B | 0 | 45780 | 0 |
| C | 0 | 43427 | 0 |
| D | 0 | 43371 | 0 |
| Mode M9 | |||
|---|---|---|---|
| Quadrant | BADHDUFLAG | Total packets | Discarded packets |
| A | 0 | 23 | 0 |
| B | 0 | 23 | 0 |
| C | 0 | 23 | 0 |
| D | 0 | 24 | 0 |
| Quadrant | Total seconds | Saturated seconds | Saturation percentage |
|---|---|---|---|
| A | 10299 | 47 | 0.456355% |
| B | 10299 | 49 | 0.475774% |
| C | 10300 | 21 | 0.203883% |
| D | 10302 | 155 | 1.504562% |
Noise dominated data is calculated using 1-second bins in cleaned event files. If a bin has >2000 counts, and if more than 50% of those come from <1% of pixels, then it is considered to be noise-dominated and hence unusable.
| Quadrant | # 1 sec bins | Bins with >0 counts | Bins with >2000 counts | High rate bins dominated by noise | Noise dominated (total time) | Noise dominated (detector-on time) | Marked lightcurve |
|---|---|---|---|---|---|---|---|
| A | 28367 | 10303 | 426 | 426 | 1.50% | 4.13% |  |
| B | 28367 | 10302 | 448 | 448 | 1.58% | 4.35% |  |
| C | 28367 | 10304 | 276 | 276 | 0.97% | 2.68% | 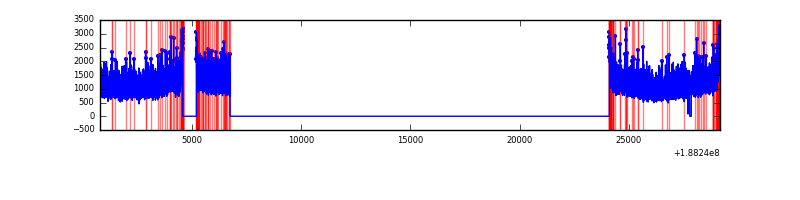 |
| D | 28368 | 10306 | 717 | 717 | 2.53% | 6.96% |  |
Top three noisy pixels from each quadrant. If the there are fewer than three noisy pixels in the level2.evt file, extra rows are filled as -1
| Pixel properties | Quadrant properties | ||||||
|---|---|---|---|---|---|---|---|
| Quadrant | DetID | PixID | Counts | Sigma | Mean | Median | Sigma |
| A | 15 | 127 | 354046 | 471.63 | 3107 | 3120 | 744.1 |
| A | 11 | 79 | 10905 | 10.46 | 3107 | 3120 | 744.1 |
| A | 13 | 235 | 10163 | 9.47 | 3107 | 3120 | 744.1 |
| B | 12 | 52 | 156841 | 201.16 | 3259 | 3275 | 763.4 |
| B | 5 | 191 | 130394 | 166.51 | 3259 | 3275 | 763.4 |
| B | 15 | 22 | 117380 | 149.47 | 3259 | 3275 | 763.4 |
| C | 15 | 241 | 532161 | 646.32 | 2950 | 3056 | 818.6 |
| C | 3 | 111 | 40690 | 45.97 | 2950 | 3056 | 818.6 |
| C | 3 | 79 | 36377 | 40.7 | 2950 | 3056 | 818.6 |
| D | 10 | 102 | 506785 | 575.12 | 2824 | 2923 | 876.1 |
| D | 13 | 169 | 337193 | 381.54 | 2824 | 2923 | 876.1 |
| D | 10 | 84 | 252737 | 285.14 | 2824 | 2923 | 876.1 |
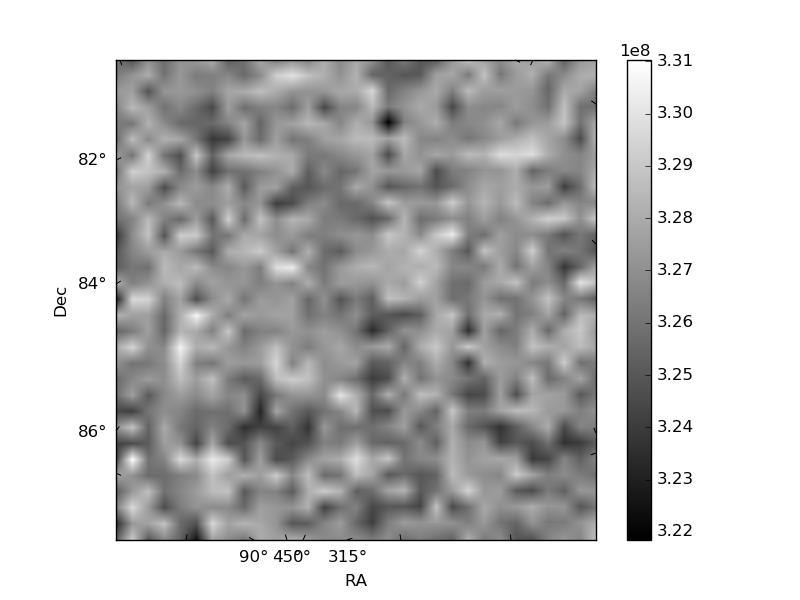
Histogram calculated using DETX and DETY for each event in the final _common_clean file
| Quadrant A |  |
 |
Quadrant B |
|---|---|---|---|
| Quadrant D |  |
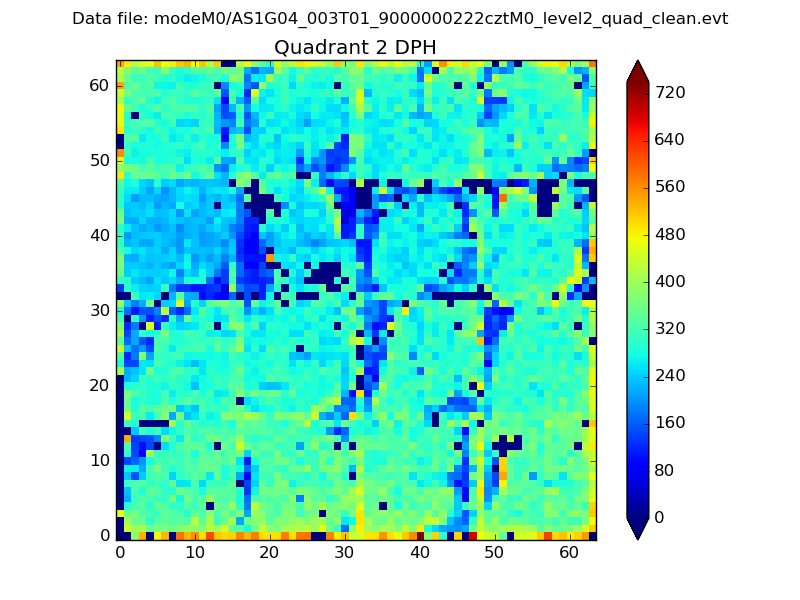 |
Quadrant C |
| Plot type | Count rate plots | Images |
|---|---|---|
| Comparison with Poisson distribution Blue bars denote a histogram of data divided into 1 sec bins. Red curve is a Poisson curve with rate = median count rate of data. |
 |
 |
| Quadrant-wise count rates Data is divided into 100 sec bins |
 |
|
| Module-wise count rates for Quadrant A Data is divided into 100 sec bins |
 |
 |
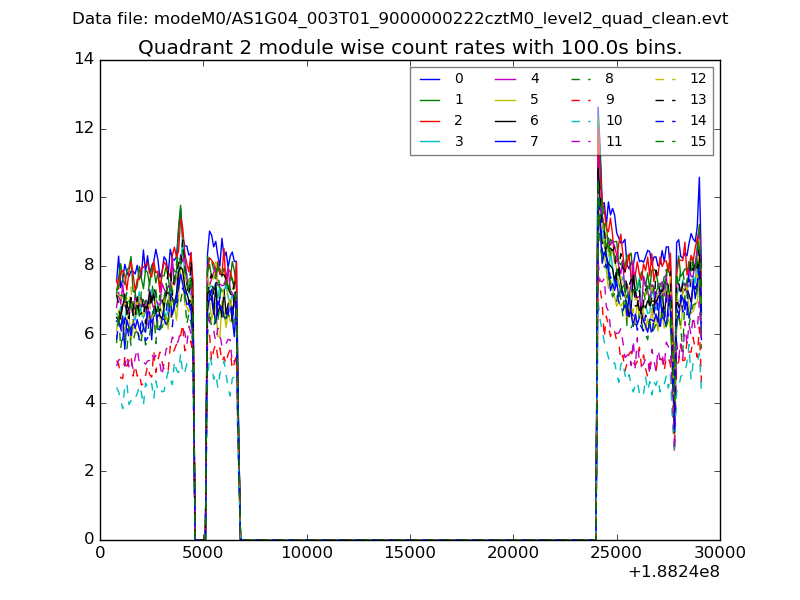
| Module-wise count rates for Quadrant B Data is divided into 100 sec bins |
 |
 |
| Module-wise count rates for Quadrant C Data is divided into 100 sec bins |
 |
 |
| Module-wise count rates for Quadrant D Data is divided into 100 sec bins |
 |
 |
| Parameter | Plot |
|---|---|
| CZT HV Monitor |  |
| D_VDD |  |
| Temperature 1 |  |
| Veto HV Monitor |  |
| Veto LLD |  |
| Alpha Counter | 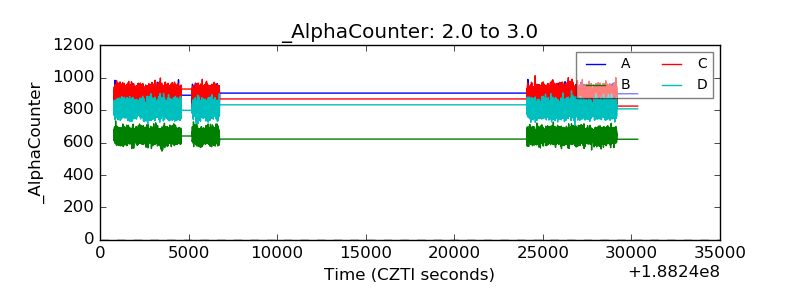 |
| _CPM_Rate | 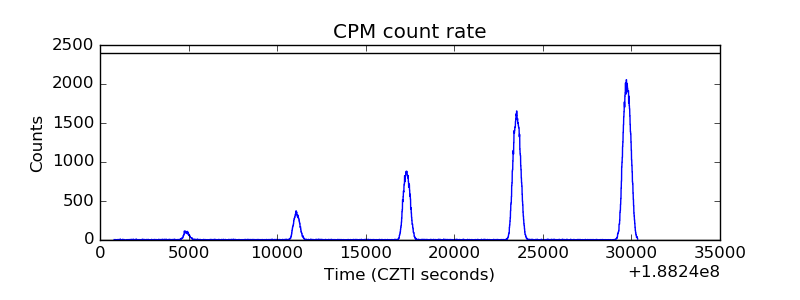 |
| CZT Counter |  |
| +2.5 Volts monitor | 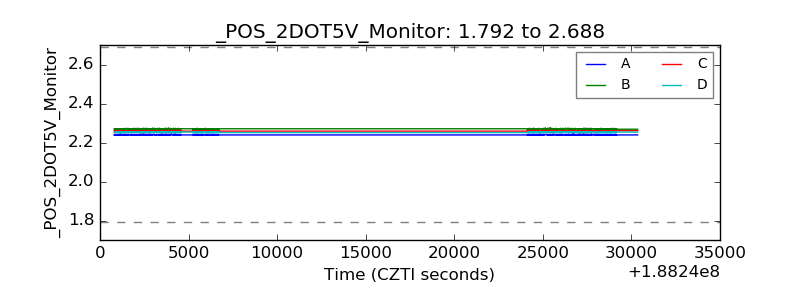 |
| +5 Volts monitor |  |
| _ROLL_ROT |  |
| _Roll_DEC |  |
| _Roll_RA |  |
| Veto Counter | 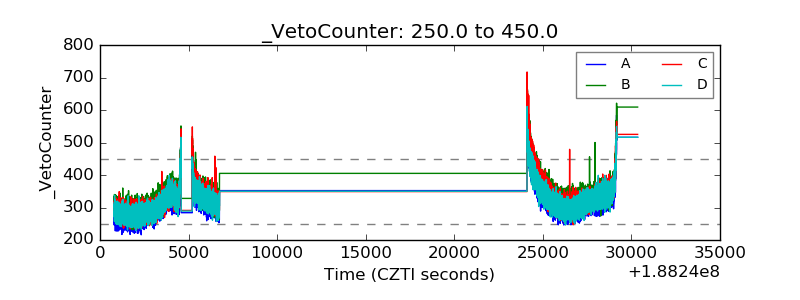 |