| Param | Original file | Final file |
|---|---|---|
| Filename | modeM0/AS1G04_007T02_9000000220cztM0_level2_bc.evt | modeM0/AS1G04_007T02_9000000220cztM0_level2_quad_clean.evt |
| Size (bytes) | 8,171,092,800 | 2,836,019,520 |
| Size | 7.6 GB | 2.6 GB |
| Events in quadrant A | 36,949,892 | 19,056,282 |
| Events in quadrant B | 42,729,120 | 18,854,716 |
| Events in quadrant C | 43,606,181 | 18,355,967 |
| Events in quadrant D | 111,248,966 | 16,614,077 |
| Mode M9 | |||
|---|---|---|---|
| Quadrant | BADHDUFLAG | Total packets | Discarded packets |
| A | 0 | 226 | 0 |
| B | 0 | 224 | 0 |
| C | 0 | 224 | 0 |
| D | 0 | 227 | 0 |
| Mode M0 | |||
|---|---|---|---|
| Quadrant | BADHDUFLAG | Total packets | Discarded packets |
| A | 0 | 814307 | 0 |
| B | 0 | 855590 | 0 |
| C | 0 | 806331 | 0 |
| D | 0 | 987160 | 0 |
| Mode SS | |||
|---|---|---|---|
| Quadrant | BADHDUFLAG | Total packets | Discarded packets |
| A | 0 | 3908 | 0 |
| B | 0 | 3908 | 0 |
| C | 0 | 3908 | 0 |
| D | 0 | 3908 | 0 |
| Quadrant | Total seconds | Saturated seconds | Saturation percentage |
|---|---|---|---|
| A | 189767 | 968 | 0.510099% |
| B | 189767 | 2220 | 1.169856% |
| C | 189767 | 471 | 0.248199% |
| D | 189766 | 29528 | 15.560216% |
Noise dominated data is calculated using 1-second bins in cleaned event files. If a bin has >2000 counts, and if more than 50% of those come from <1% of pixels, then it is considered to be noise-dominated and hence unusable.
| Quadrant | # 1 sec bins | Bins with >0 counts | Bins with >2000 counts | High rate bins dominated by noise | Noise dominated (total time) | Noise dominated (detector-on time) | Marked lightcurve |
|---|---|---|---|---|---|---|---|
| A | 225607 | 192114 | 173 | 173 | 0.08% | 0.09% |  |
| B | 225607 | 192087 | 329 | 329 | 0.15% | 0.17% |  |
| C | 225607 | 192155 | 2 | 2 | 0.00% | 0.00% |  |
| D | 225607 | 192182 | 20670 | 20670 | 9.16% | 10.76% |  |
Top three noisy pixels from each quadrant. If the there are fewer than three noisy pixels in the level2.evt file, extra rows are filled as -1
| Pixel properties | Quadrant properties | ||||||
|---|---|---|---|---|---|---|---|
| Quadrant | DetID | PixID | Counts | Sigma | Mean | Median | Sigma |
| A | 15 | 127 | 1884324 | 1060.03 | 8437 | 8251 | 1769.8 |
| A | 4 | 32 | 883987 | 494.81 | 8437 | 8251 | 1769.8 |
| A | 8 | 14 | 574326 | 319.85 | 8437 | 8251 | 1769.8 |
| B | 2 | 32 | 3204207 | 2131.72 | 8502 | 8265 | 1499.2 |
| B | 5 | 191 | 2008729 | 1334.33 | 8502 | 8265 | 1499.2 |
| B | 6 | 53 | 1364712 | 904.76 | 8502 | 8265 | 1499.2 |
| C | 15 | 241 | 9809920 | 5774.28 | 8116 | 7954 | 1697.5 |
| C | 3 | 79 | 813851 | 474.75 | 8116 | 7954 | 1697.5 |
| C | 3 | 111 | 464526 | 268.96 | 8116 | 7954 | 1697.5 |
| D | 1 | 239 | 66865791 | 40397.6 | 7580 | 7347 | 1655.0 |
| D | 10 | 84 | 4732206 | 2854.88 | 7580 | 7347 | 1655.0 |
| D | 1 | 83 | 2018278 | 1215.06 | 7580 | 7347 | 1655.0 |
Histogram calculated using DETX and DETY for each event in the final _common_clean file
| Quadrant A |  |
 |
Quadrant B |
|---|---|---|---|
| Quadrant D |  |
 |
Quadrant C |
| Plot type | Count rate plots | Images |
|---|---|---|
| Comparison with Poisson distribution Blue bars denote a histogram of data divided into 1 sec bins. Red curve is a Poisson curve with rate = median count rate of data. |
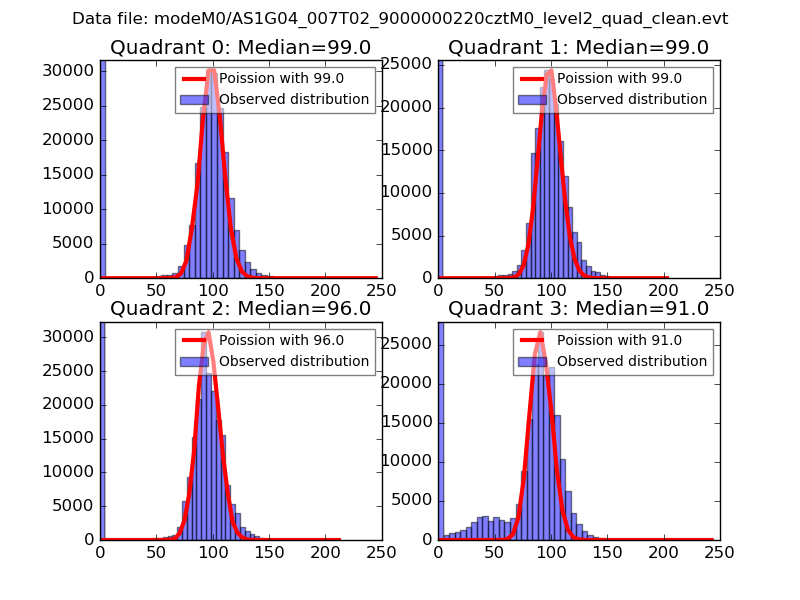 |
 |
| Quadrant-wise count rates Data is divided into 100 sec bins |
 |
|
| Module-wise count rates for Quadrant A Data is divided into 100 sec bins |
 |
 |
| Module-wise count rates for Quadrant B Data is divided into 100 sec bins |
 |
 |
| Module-wise count rates for Quadrant C Data is divided into 100 sec bins |
 |
 |
| Module-wise count rates for Quadrant D Data is divided into 100 sec bins |
 |
 |
| Parameter | Plot |
|---|---|
| CZT HV Monitor |  |
| D_VDD |  |
| Temperature 1 |  |
| Veto HV Monitor |  |
| Veto LLD |  |
| Alpha Counter |  |
| _CPM_Rate |  |
| CZT Counter |  |
| +2.5 Volts monitor |  |
| +5 Volts monitor |  |
| Veto Counter |  |