| Param | Original file | Final file |
|---|---|---|
| Filename | modeM0/AS1P01_997T02_9000000218cztM0_level2.evt | modeM0/AS1P01_997T02_9000000218cztM0_level2_quad_clean.evt |
| Size (bytes) | 13,107,908,160 | 1,087,136,640 |
| Size | 12.2 GB | 1.0 GB |
| Events in quadrant A | 79,808,415 | 7,546,902 |
| Events in quadrant B | 87,194,023 | 7,523,615 |
| Events in quadrant C | 80,098,251 | 7,332,426 |
| Events in quadrant D | 145,516,788 | 5,956,795 |
| Mode M9 | |||
|---|---|---|---|
| Quadrant | BADHDUFLAG | Total packets | Discarded packets |
| A | 0 | 77 | 0 |
| B | 0 | 77 | 0 |
| C | 0 | 77 | 0 |
| D | 0 | 77 | 0 |
| Mode SS | |||
|---|---|---|---|
| Quadrant | BADHDUFLAG | Total packets | Discarded packets |
| A | 0 | 1350 | 0 |
| B | 0 | 1350 | 0 |
| C | 0 | 1350 | 0 |
| D | 0 | 1350 | 0 |
| Mode M0 | |||
|---|---|---|---|
| Quadrant | BADHDUFLAG | Total packets | Discarded packets |
| A | 0 | 284465 | 0 |
| B | 0 | 306311 | 0 |
| C | 0 | 285141 | 0 |
| D | 0 | 483385 | 0 |
| Quadrant | Total seconds | Saturated seconds | Saturation percentage |
|---|---|---|---|
| A | 66493 | 446 | 0.670747% |
| B | 66493 | 1468 | 2.207751% |
| C | 66493 | 273 | 0.410570% |
| D | 66493 | 26155 | 39.334968% |
Noise dominated data is calculated using 1-second bins in cleaned event files. If a bin has >2000 counts, and if more than 50% of those come from <1% of pixels, then it is considered to be noise-dominated and hence unusable.
| Quadrant | # 1 sec bins | Bins with >0 counts | Bins with >2000 counts | High rate bins dominated by noise | Noise dominated (total time) | Noise dominated (detector-on time) | Marked lightcurve |
|---|---|---|---|---|---|---|---|
| A | 82331 | 66502 | 2758 | 2758 | 3.35% | 4.15% |  |
| B | 82330 | 66502 | 4717 | 4717 | 5.73% | 7.09% | 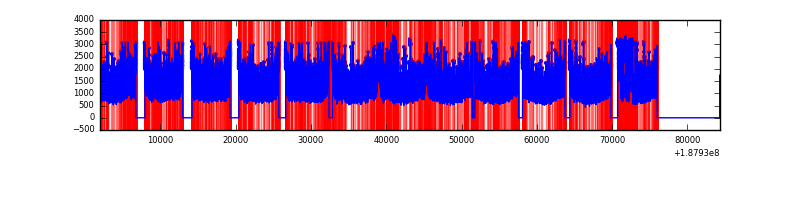 |
| C | 82331 | 66502 | 2528 | 2528 | 3.07% | 3.80% |  |
| D | 82331 | 66503 | 39697 | 39697 | 48.22% | 59.69% |  |
Top three noisy pixels from each quadrant. If the there are fewer than three noisy pixels in the level2.evt file, extra rows are filled as -1
| Pixel properties | Quadrant properties | ||||||
|---|---|---|---|---|---|---|---|
| Quadrant | DetID | PixID | Counts | Sigma | Mean | Median | Sigma |
| A | 4 | 32 | 824018 | 164.98 | 20391 | 20504 | 4870.4 |
| A | 12 | 243 | 483082 | 94.98 | 20391 | 20504 | 4870.4 |
| A | 15 | 233 | 106279 | 17.61 | 20391 | 20504 | 4870.4 |
| B | 8 | 234 | 3534162 | 709.87 | 20986 | 21106 | 4948.9 |
| B | 2 | 32 | 1669891 | 333.16 | 20986 | 21106 | 4948.9 |
| B | 5 | 191 | 641643 | 125.39 | 20986 | 21106 | 4948.9 |
| C | 15 | 241 | 3204412 | 594.83 | 19174 | 19825 | 5353.8 |
| C | 9 | 83 | 1431857 | 263.74 | 19174 | 19825 | 5353.8 |
| C | 3 | 111 | 243381 | 41.76 | 19174 | 19825 | 5353.8 |
| D | 1 | 239 | 78867223 | 15490.41 | 16575 | 17196 | 5090.2 |
| D | 10 | 84 | 1673579 | 325.4 | 16575 | 17196 | 5090.2 |
| D | 2 | 16 | 1151112 | 222.76 | 16575 | 17196 | 5090.2 |
Histogram calculated using DETX and DETY for each event in the final _common_clean file
| Quadrant A |  |
 |
Quadrant B |
|---|---|---|---|
| Quadrant D | 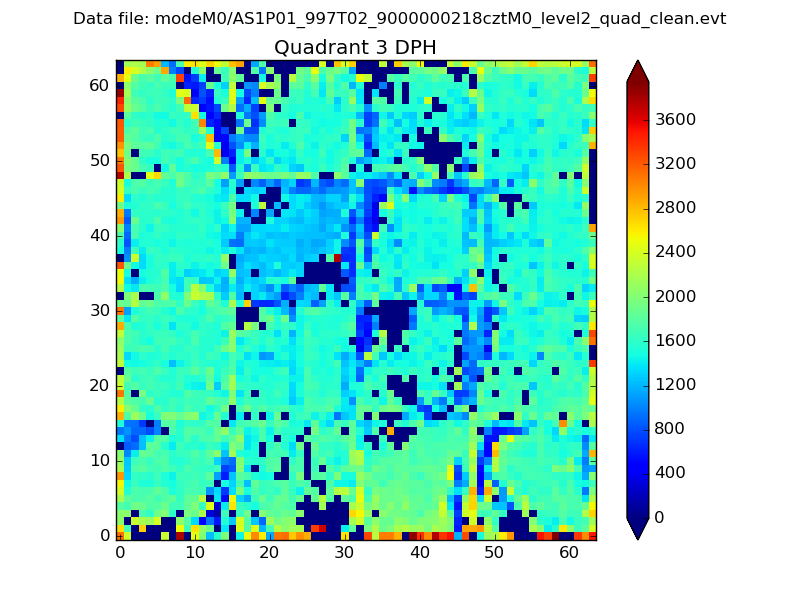 |
 |
Quadrant C |
| Plot type | Count rate plots | Images |
|---|---|---|
| Comparison with Poisson distribution Blue bars denote a histogram of data divided into 1 sec bins. Red curve is a Poisson curve with rate = median count rate of data. |
 |
 |
| Quadrant-wise count rates Data is divided into 100 sec bins |
 |
|
| Module-wise count rates for Quadrant A Data is divided into 100 sec bins |
 |
 |
| Module-wise count rates for Quadrant B Data is divided into 100 sec bins |
 |
 |
| Module-wise count rates for Quadrant C Data is divided into 100 sec bins |
 |
 |
| Module-wise count rates for Quadrant D Data is divided into 100 sec bins |
 |
 |
| Parameter | Plot |
|---|---|
| CZT HV Monitor |  |
| D_VDD | 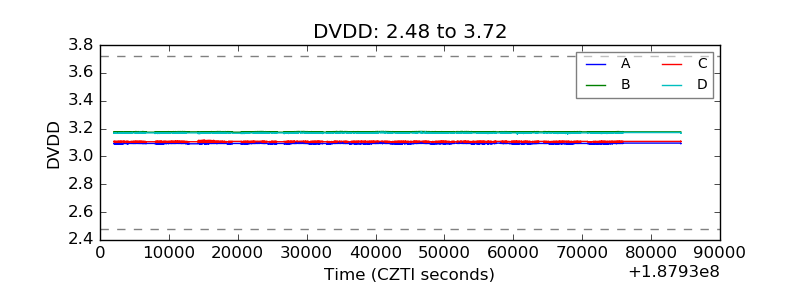 |
| Temperature 1 |  |
| Veto HV Monitor |  |
| Veto LLD |  |
| Alpha Counter |  |
| _CPM_Rate |  |
| CZT Counter |  |
| +2.5 Volts monitor |  |
| +5 Volts monitor | 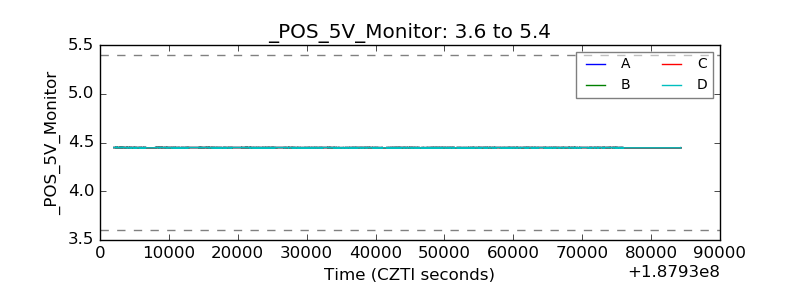 |
| _ROLL_ROT |  |
| _Roll_DEC |  |
| _Roll_RA |  |
| Veto Counter |  |