| Param | Original file | Final file |
|---|---|---|
| Filename | modeM0/AS1P01_997T01_9000000214cztM0_level2.evt | modeM0/AS1P01_997T01_9000000214cztM0_level2_quad_clean.evt |
| Size (bytes) | 16,324,300,800 | 1,752,834,240 |
| Size | 15.2 GB | 1.6 GB |
| Events in quadrant A | 121,116,789 | 11,751,808 |
| Events in quadrant B | 127,455,348 | 11,820,015 |
| Events in quadrant C | 125,388,704 | 11,302,322 |
| Events in quadrant D | 113,667,202 | 11,190,548 |
| Mode SS | |||
|---|---|---|---|
| Quadrant | BADHDUFLAG | Total packets | Discarded packets |
| A | 0 | 2088 | 0 |
| B | 0 | 2088 | 0 |
| C | 0 | 2088 | 0 |
| D | 0 | 2088 | 0 |
| Mode M9 | |||
|---|---|---|---|
| Quadrant | BADHDUFLAG | Total packets | Discarded packets |
| A | 0 | 158 | 0 |
| B | 0 | 158 | 0 |
| C | 0 | 158 | 0 |
| D | 0 | 158 | 0 |
| Mode M0 | |||
|---|---|---|---|
| Quadrant | BADHDUFLAG | Total packets | Discarded packets |
| A | 0 | 432663 | 0 |
| B | 0 | 451541 | 0 |
| C | 0 | 445534 | 0 |
| D | 0 | 411220 | 0 |
| Quadrant | Total seconds | Saturated seconds | Saturation percentage |
|---|---|---|---|
| A | 102628 | 273 | 0.266009% |
| B | 102629 | 367 | 0.357599% |
| C | 102629 | 1159 | 1.129310% |
| D | 102628 | 1118 | 1.089371% |
Noise dominated data is calculated using 1-second bins in cleaned event files. If a bin has >2000 counts, and if more than 50% of those come from <1% of pixels, then it is considered to be noise-dominated and hence unusable.
| Quadrant | # 1 sec bins | Bins with >0 counts | Bins with >2000 counts | High rate bins dominated by noise | Noise dominated (total time) | Noise dominated (detector-on time) | Marked lightcurve |
|---|---|---|---|---|---|---|---|
| A | 123600 | 102649 | 3266 | 3266 | 2.64% | 3.18% |  |
| B | 123600 | 102651 | 4087 | 4087 | 3.31% | 3.98% |  |
| C | 123600 | 102652 | 4595 | 4595 | 3.72% | 4.48% |  |
| D | 123600 | 102651 | 3693 | 3693 | 2.99% | 3.60% | 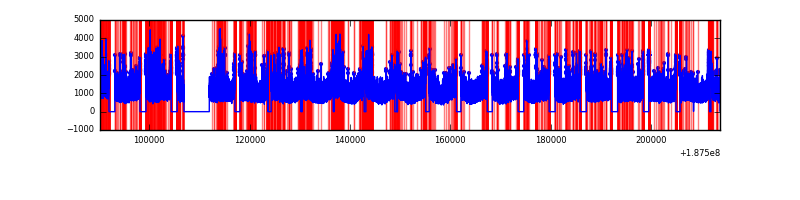 |
Top three noisy pixels from each quadrant. If the there are fewer than three noisy pixels in the level2.evt file, extra rows are filled as -1
| Pixel properties | Quadrant properties | ||||||
|---|---|---|---|---|---|---|---|
| Quadrant | DetID | PixID | Counts | Sigma | Mean | Median | Sigma |
| A | 4 | 32 | 180496 | 19.81 | 31413 | 31590 | 7515.3 |
| A | 12 | 243 | 166996 | 18.02 | 31413 | 31590 | 7515.3 |
| A | 0 | 175 | 142826 | 14.8 | 31413 | 31590 | 7515.3 |
| B | 2 | 32 | 1040122 | 132.71 | 32529 | 32678 | 7591.5 |
| B | 15 | 22 | 809889 | 102.38 | 32529 | 32678 | 7591.5 |
| B | 8 | 4 | 497483 | 61.23 | 32529 | 32678 | 7591.5 |
| C | 15 | 241 | 5306556 | 644.82 | 29429 | 30425 | 8182.4 |
| C | 5 | 234 | 2569632 | 310.33 | 29429 | 30425 | 8182.4 |
| C | 9 | 54 | 1364014 | 162.98 | 29429 | 30425 | 8182.4 |
| D | 2 | 16 | 903309 | 103.74 | 29529 | 30087 | 8417.1 |
| D | 10 | 125 | 891092 | 102.29 | 29529 | 30087 | 8417.1 |
| D | 7 | 67 | 310739 | 33.34 | 29529 | 30087 | 8417.1 |
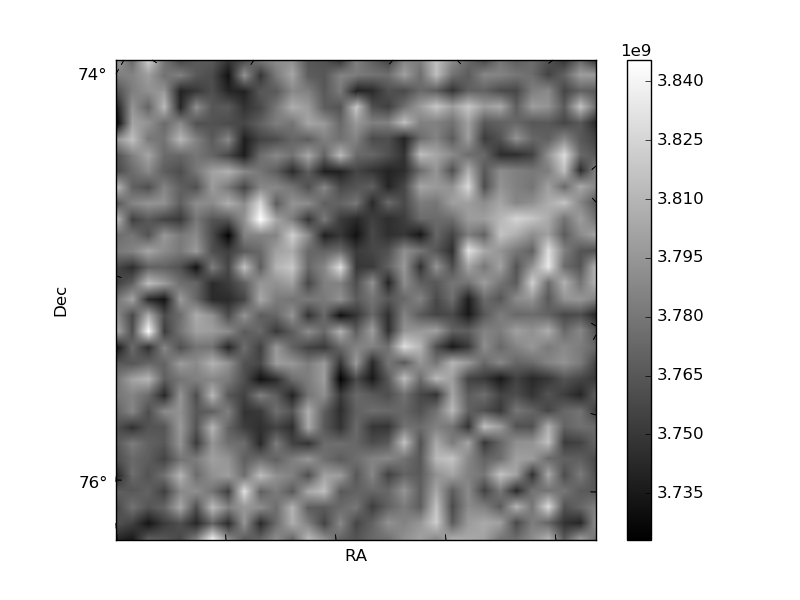
Histogram calculated using DETX and DETY for each event in the final _common_clean file
| Quadrant A | 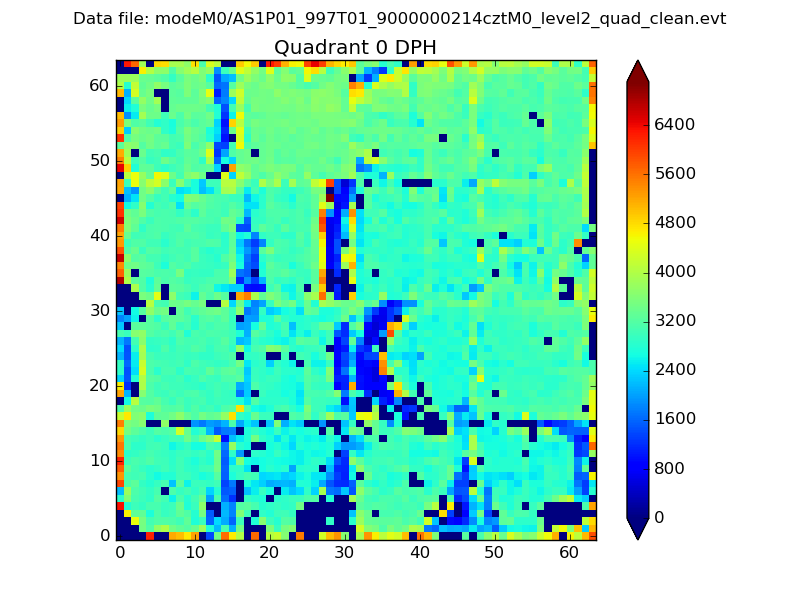 |
 |
Quadrant B |
|---|---|---|---|
| Quadrant D |  |
 |
Quadrant C |
| Plot type | Count rate plots | Images |
|---|---|---|
| Comparison with Poisson distribution Blue bars denote a histogram of data divided into 1 sec bins. Red curve is a Poisson curve with rate = median count rate of data. |
 |
 |
| Quadrant-wise count rates Data is divided into 100 sec bins |
 |
|
| Module-wise count rates for Quadrant A Data is divided into 100 sec bins |
 |
 |
| Module-wise count rates for Quadrant B Data is divided into 100 sec bins |
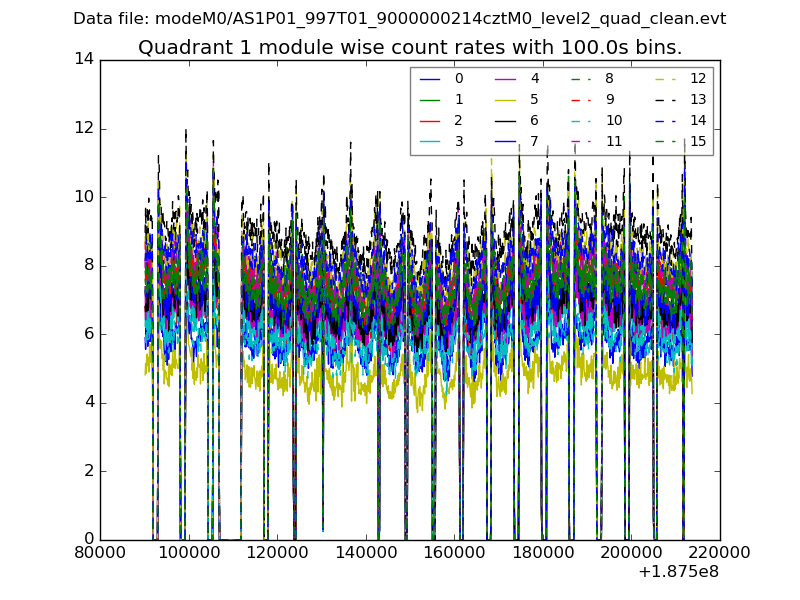 |
 |
| Module-wise count rates for Quadrant C Data is divided into 100 sec bins |
 |
 |
| Module-wise count rates for Quadrant D Data is divided into 100 sec bins |
 |
 |
| Parameter | Plot |
|---|---|
| CZT HV Monitor | 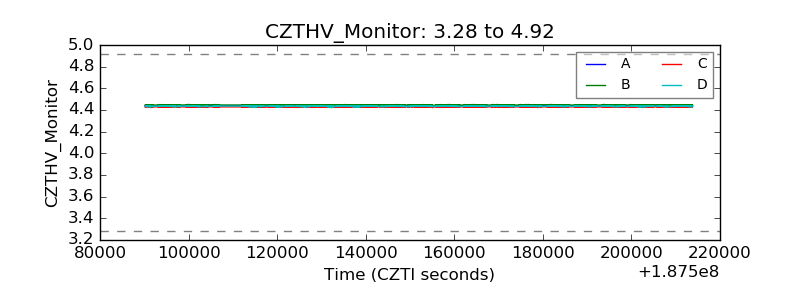 |
| D_VDD | 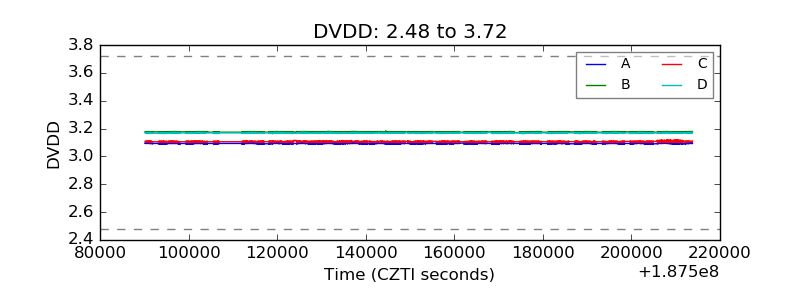 |
| Temperature 1 |  |
| Veto HV Monitor |  |
| Veto LLD |  |
| Alpha Counter |  |
| _CPM_Rate |  |
| CZT Counter | 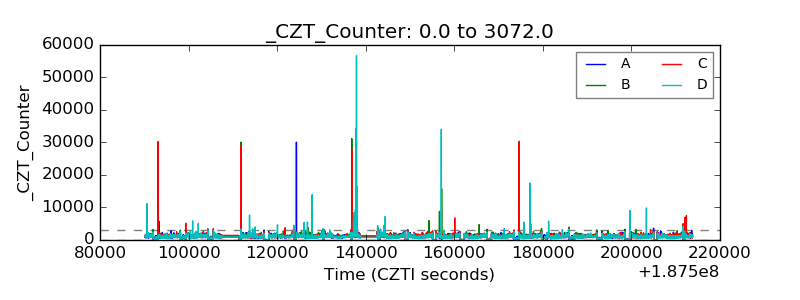 |
| +2.5 Volts monitor | 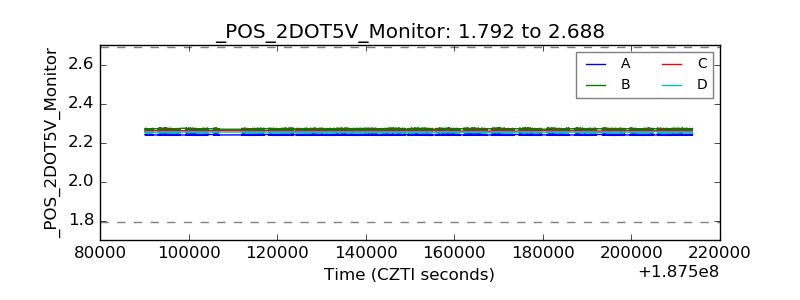 |
| +5 Volts monitor |  |
| _ROLL_ROT |  |
| _Roll_DEC |  |
| _Roll_RA |  |
| Veto Counter |  |