| Param | Original file | Final file |
|---|---|---|
| Filename | modeM0/AS1P01_997T02_9000000212cztM0_level2.evt | modeM0/AS1P01_997T02_9000000212cztM0_level2_quad_clean.evt |
| Size (bytes) | 19,568,508,480 | 2,071,080,000 |
| Size | 18.2 GB | 1.9 GB |
| Events in quadrant A | 145,574,768 | 13,819,362 |
| Events in quadrant B | 150,609,430 | 13,940,383 |
| Events in quadrant C | 146,656,295 | 13,453,718 |
| Events in quadrant D | 141,742,594 | 13,141,552 |
| Mode SS | |||
|---|---|---|---|
| Quadrant | BADHDUFLAG | Total packets | Discarded packets |
| A | 0 | 2494 | 0 |
| B | 0 | 2494 | 0 |
| C | 0 | 2494 | 0 |
| D | 0 | 2494 | 0 |
| Mode M9 | |||
|---|---|---|---|
| Quadrant | BADHDUFLAG | Total packets | Discarded packets |
| A | 0 | 159 | 0 |
| B | 0 | 159 | 0 |
| C | 0 | 159 | 0 |
| D | 0 | 159 | 0 |
| Mode M0 | |||
|---|---|---|---|
| Quadrant | BADHDUFLAG | Total packets | Discarded packets |
| A | 0 | 519390 | 0 |
| B | 0 | 534262 | 0 |
| C | 0 | 522606 | 0 |
| D | 0 | 508802 | 0 |
| Quadrant | Total seconds | Saturated seconds | Saturation percentage |
|---|---|---|---|
| A | 122348 | 957 | 0.782195% |
| B | 122350 | 445 | 0.363711% |
| C | 122350 | 482 | 0.393952% |
| D | 122348 | 2437 | 1.991859% |
Noise dominated data is calculated using 1-second bins in cleaned event files. If a bin has >2000 counts, and if more than 50% of those come from <1% of pixels, then it is considered to be noise-dominated and hence unusable.
| Quadrant | # 1 sec bins | Bins with >0 counts | Bins with >2000 counts | High rate bins dominated by noise | Noise dominated (total time) | Noise dominated (detector-on time) | Marked lightcurve |
|---|---|---|---|---|---|---|---|
| A | 152297 | 122373 | 4853 | 4853 | 3.19% | 3.97% |  |
| B | 152297 | 122375 | 4684 | 4684 | 3.08% | 3.83% |  |
| C | 152297 | 122375 | 4331 | 4331 | 2.84% | 3.54% |  |
| D | 152297 | 122374 | 6452 | 6452 | 4.24% | 5.27% |  |
Top three noisy pixels from each quadrant. If the there are fewer than three noisy pixels in the level2.evt file, extra rows are filled as -1
| Pixel properties | Quadrant properties | ||||||
|---|---|---|---|---|---|---|---|
| Quadrant | DetID | PixID | Counts | Sigma | Mean | Median | Sigma |
| A | 4 | 32 | 3061786 | 342.95 | 37005 | 37191 | 8819.3 |
| A | 12 | 243 | 287246 | 28.35 | 37005 | 37191 | 8819.3 |
| A | 15 | 233 | 203639 | 18.87 | 37005 | 37191 | 8819.3 |
| B | 5 | 191 | 624919 | 64.55 | 38646 | 38775 | 9080.2 |
| B | 5 | 249 | 547604 | 56.04 | 38646 | 38775 | 9080.2 |
| B | 15 | 22 | 540098 | 55.21 | 38646 | 38775 | 9080.2 |
| C | 15 | 241 | 5906570 | 598.42 | 35106 | 36285 | 9809.6 |
| C | 10 | 207 | 2325603 | 233.38 | 35106 | 36285 | 9809.6 |
| C | 3 | 79 | 524099 | 49.73 | 35106 | 36285 | 9809.6 |
| D | 12 | 22 | 3217951 | 308.33 | 35356 | 35734 | 10320.7 |
| D | 2 | 216 | 2443570 | 233.3 | 35356 | 35734 | 10320.7 |
| D | 13 | 73 | 627410 | 57.33 | 35356 | 35734 | 10320.7 |
Histogram calculated using DETX and DETY for each event in the final _common_clean file
| Quadrant A |  |
 |
Quadrant B |
|---|---|---|---|
| Quadrant D | 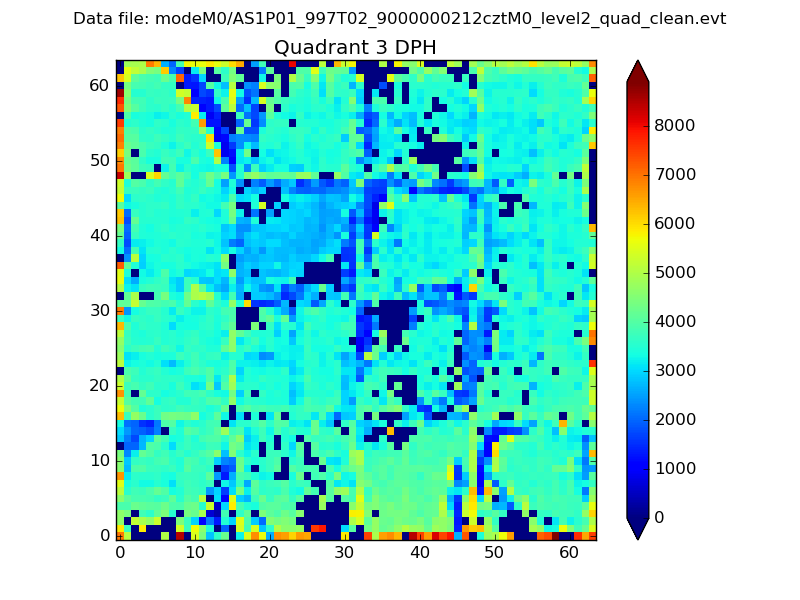 |
 |
Quadrant C |
| Plot type | Count rate plots | Images |
|---|---|---|
| Comparison with Poisson distribution Blue bars denote a histogram of data divided into 1 sec bins. Red curve is a Poisson curve with rate = median count rate of data. |
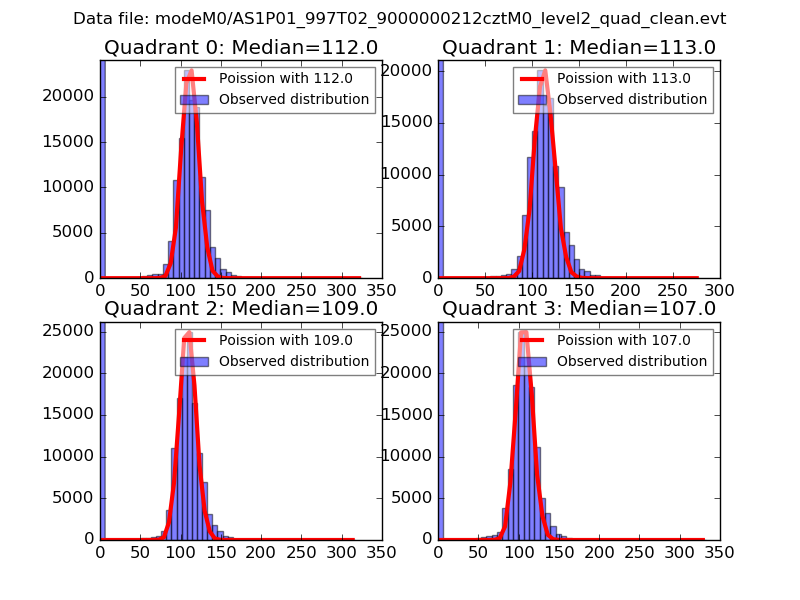 |
 |
| Quadrant-wise count rates Data is divided into 100 sec bins |
 |
|
| Module-wise count rates for Quadrant A Data is divided into 100 sec bins |
 |
 |
| Module-wise count rates for Quadrant B Data is divided into 100 sec bins |
 |
 |
| Module-wise count rates for Quadrant C Data is divided into 100 sec bins |
 |
 |
| Module-wise count rates for Quadrant D Data is divided into 100 sec bins |
 |
 |
| Parameter | Plot |
|---|---|
| CZT HV Monitor |  |
| D_VDD |  |
| Temperature 1 | 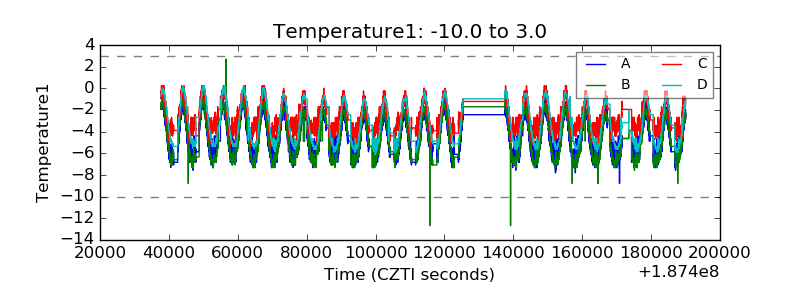 |
| Veto HV Monitor |  |
| Veto LLD |  |
| Alpha Counter |  |
| _CPM_Rate |  |
| CZT Counter |  |
| +2.5 Volts monitor |  |
| +5 Volts monitor |  |
| _ROLL_ROT |  |
| _Roll_DEC |  |
| _Roll_RA |  |
| Veto Counter |  |