| Param | Original file | Final file |
|---|---|---|
| Filename | modeM0/AS1P01_180T10_9000000208cztM0_level2_bc.evt | modeM0/AS1P01_180T10_9000000208cztM0_level2_quad_clean.evt |
| Size (bytes) | 138,081,600 | 63,861,120 |
| Size | 131.7 MB | 60.9 MB |
| Events in quadrant A | 727,791 | 427,311 |
| Events in quadrant B | 927,176 | 423,411 |
| Events in quadrant C | 961,968 | 405,082 |
| Events in quadrant D | 1,279,207 | 390,747 |
| Mode M0 | |||
|---|---|---|---|
| Quadrant | BADHDUFLAG | Total packets | Discarded packets |
| A | 0 | 17065 | 0 |
| B | 0 | 18094 | 0 |
| C | 0 | 17350 | 0 |
| D | 0 | 18653 | 0 |
| Mode SS | |||
|---|---|---|---|
| Quadrant | BADHDUFLAG | Total packets | Discarded packets |
| A | 0 | 84 | 0 |
| B | 0 | 84 | 0 |
| C | 0 | 84 | 0 |
| D | 0 | 84 | 0 |
| Mode M9 | |||
|---|---|---|---|
| Quadrant | BADHDUFLAG | Total packets | Discarded packets |
| A | 0 | 3 | 0 |
| B | 0 | 3 | 0 |
| C | 0 | 3 | 0 |
| D | 0 | 3 | 0 |
| Quadrant | Total seconds | Saturated seconds | Saturation percentage |
|---|---|---|---|
| A | 4072 | 48 | 1.178782% |
| B | 4072 | 74 | 1.817289% |
| C | 4072 | 42 | 1.031434% |
| D | 4072 | 232 | 5.697446% |
Noise dominated data is calculated using 1-second bins in cleaned event files. If a bin has >2000 counts, and if more than 50% of those come from <1% of pixels, then it is considered to be noise-dominated and hence unusable.
| Quadrant | # 1 sec bins | Bins with >0 counts | Bins with >2000 counts | High rate bins dominated by noise | Noise dominated (total time) | Noise dominated (detector-on time) | Marked lightcurve |
|---|---|---|---|---|---|---|---|
| A | 4071 | 4071 | 0 | 0 | 0.00% | 0.00% | 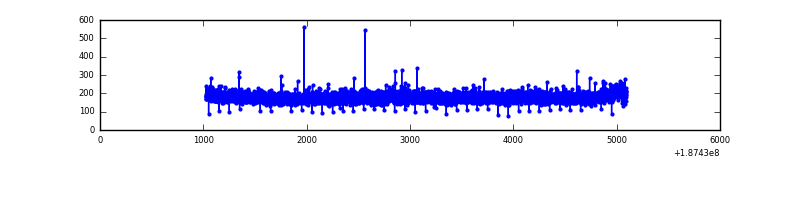 |
| B | 4071 | 4071 | 6 | 6 | 0.15% | 0.15% | 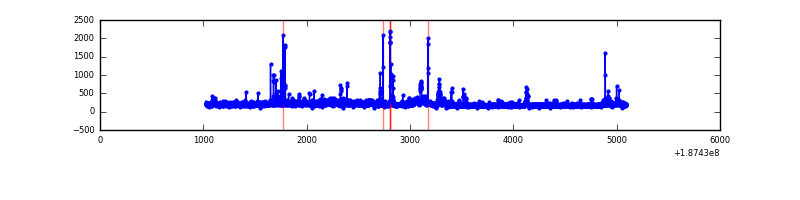 |
| C | 4071 | 4071 | 0 | 0 | 0.00% | 0.00% |  |
| D | 4071 | 4071 | 14 | 14 | 0.34% | 0.34% |  |
Top three noisy pixels from each quadrant. If the there are fewer than three noisy pixels in the level2.evt file, extra rows are filled as -1
| Pixel properties | Quadrant properties | ||||||
|---|---|---|---|---|---|---|---|
| Quadrant | DetID | PixID | Counts | Sigma | Mean | Median | Sigma |
| A | 13 | 9 | 3228 | 73.77 | 187 | 183 | 41.3 |
| A | 12 | 243 | 1499 | 31.88 | 187 | 183 | 41.3 |
| A | 13 | 235 | 1022 | 20.33 | 187 | 183 | 41.3 |
| B | 15 | 22 | 48972 | 1370.47 | 188 | 184 | 35.6 |
| B | 14 | 53 | 30130 | 841.19 | 188 | 184 | 35.6 |
| B | 5 | 191 | 25974 | 724.45 | 188 | 184 | 35.6 |
| C | 15 | 241 | 187120 | 4774.03 | 178 | 175 | 39.2 |
| C | 3 | 79 | 24343 | 617.18 | 178 | 175 | 39.2 |
| C | 9 | 54 | 16443 | 415.44 | 178 | 175 | 39.2 |
| D | 2 | 16 | 266651 | 6639.37 | 176 | 170 | 40.1 |
| D | 13 | 73 | 200720 | 4996.7 | 176 | 170 | 40.1 |
| D | 12 | 22 | 63275 | 1572.26 | 176 | 170 | 40.1 |
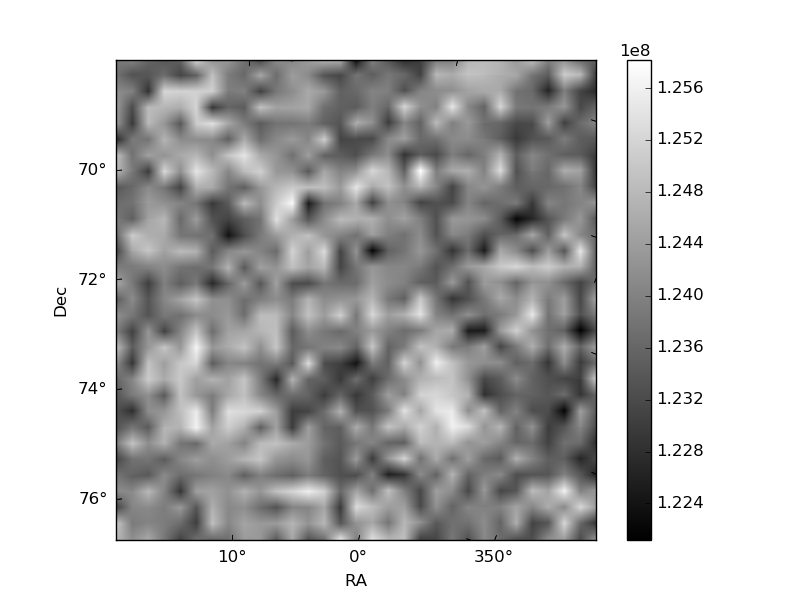
Histogram calculated using DETX and DETY for each event in the final _common_clean file
| Quadrant A |  |
 |
Quadrant B |
|---|---|---|---|
| Quadrant D |  |
 |
Quadrant C |
| Plot type | Count rate plots | Images |
|---|---|---|
| Comparison with Poisson distribution Blue bars denote a histogram of data divided into 1 sec bins. Red curve is a Poisson curve with rate = median count rate of data. |
 |
 |
| Quadrant-wise count rates Data is divided into 100 sec bins |
 |
|
| Module-wise count rates for Quadrant A Data is divided into 100 sec bins |
 |
 |
| Module-wise count rates for Quadrant B Data is divided into 100 sec bins |
 |
 |
| Module-wise count rates for Quadrant C Data is divided into 100 sec bins |
 |
 |
| Module-wise count rates for Quadrant D Data is divided into 100 sec bins |
 |
 |
| Parameter | Plot |
|---|---|
| CZT HV Monitor |  |
| D_VDD |  |
| Temperature 1 |  |
| Veto HV Monitor | 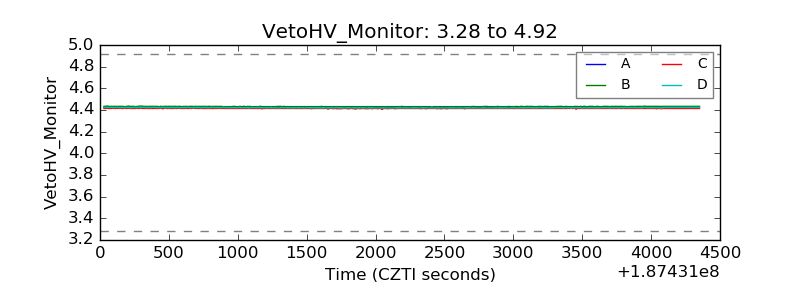 |
| Veto LLD |  |
| Alpha Counter | 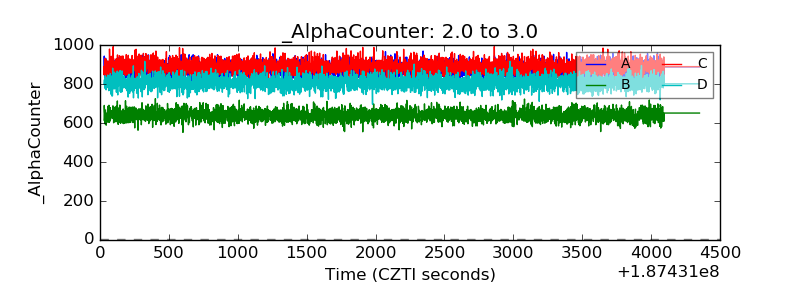 |
| _CPM_Rate |  |
| CZT Counter |  |
| +2.5 Volts monitor |  |
| +5 Volts monitor |  |
| _ROLL_ROT |  |
| _Roll_DEC |  |
| _Roll_RA | 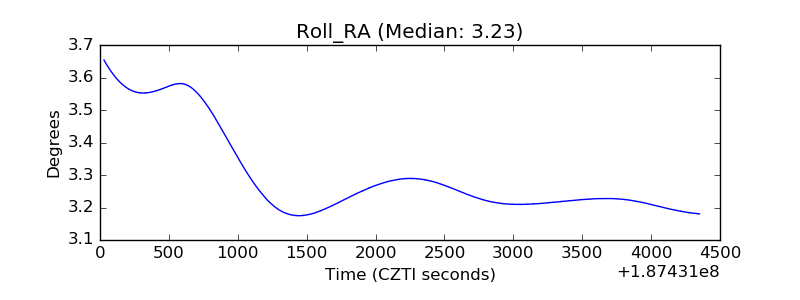 |
| Veto Counter |  |