| Param | Original file | Final file |
|---|---|---|
| Filename | modeM0/AS1P01_180T10_9000000200cztM0_level2_bc.evt | modeM0/AS1P01_180T10_9000000200cztM0_level2_quad_clean.evt |
| Size (bytes) | 99,889,920 | 50,670,720 |
| Size | 95.3 MB | 48.3 MB |
| Events in quadrant A | 567,089 | 333,020 |
| Events in quadrant B | 714,055 | 329,829 |
| Events in quadrant C | 744,862 | 317,916 |
| Events in quadrant D | 762,943 | 316,168 |
| Mode SS | |||
|---|---|---|---|
| Quadrant | BADHDUFLAG | Total packets | Discarded packets |
| A | 0 | 70 | 0 |
| B | 0 | 70 | 0 |
| C | 0 | 70 | 0 |
| D | 0 | 70 | 0 |
| Mode M0 | |||
|---|---|---|---|
| Quadrant | BADHDUFLAG | Total packets | Discarded packets |
| A | 0 | 13905 | 0 |
| B | 0 | 14778 | 0 |
| C | 0 | 14123 | 0 |
| D | 0 | 13647 | 0 |
| Mode M9 | |||
|---|---|---|---|
| Quadrant | BADHDUFLAG | Total packets | Discarded packets |
| A | 0 | 10 | 0 |
| B | 0 | 10 | 0 |
| C | 0 | 10 | 0 |
| D | 0 | 10 | 0 |
| Quadrant | Total seconds | Saturated seconds | Saturation percentage |
|---|---|---|---|
| A | 3342 | 37 | 1.107121% |
| B | 3342 | 60 | 1.795332% |
| C | 3342 | 24 | 0.718133% |
| D | 3342 | 31 | 0.927588% |
Noise dominated data is calculated using 1-second bins in cleaned event files. If a bin has >2000 counts, and if more than 50% of those come from <1% of pixels, then it is considered to be noise-dominated and hence unusable.
| Quadrant | # 1 sec bins | Bins with >0 counts | Bins with >2000 counts | High rate bins dominated by noise | Noise dominated (total time) | Noise dominated (detector-on time) | Marked lightcurve |
|---|---|---|---|---|---|---|---|
| A | 3341 | 3341 | 0 | 0 | 0.00% | 0.00% |  |
| B | 3341 | 3341 | 0 | 0 | 0.00% | 0.00% | 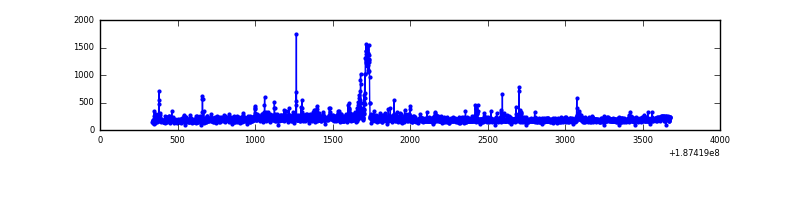 |
| C | 3341 | 3341 | 0 | 0 | 0.00% | 0.00% |  |
| D | 3341 | 3341 | 8 | 8 | 0.24% | 0.24% |  |
Top three noisy pixels from each quadrant. If the there are fewer than three noisy pixels in the level2.evt file, extra rows are filled as -1
| Pixel properties | Quadrant properties | ||||||
|---|---|---|---|---|---|---|---|
| Quadrant | DetID | PixID | Counts | Sigma | Mean | Median | Sigma |
| A | 13 | 193 | 1524 | 41.6 | 146 | 142 | 33.2 |
| A | 13 | 9 | 1318 | 35.4 | 146 | 142 | 33.2 |
| A | 0 | 36 | 695 | 16.65 | 146 | 142 | 33.2 |
| B | 15 | 22 | 40739 | 1384.26 | 147 | 143 | 29.3 |
| B | 4 | 172 | 40006 | 1359.27 | 147 | 143 | 29.3 |
| B | 4 | 187 | 21620 | 732.33 | 147 | 143 | 29.3 |
| C | 15 | 241 | 153797 | 4858.67 | 140 | 136 | 31.6 |
| C | 3 | 79 | 21620 | 679.3 | 140 | 136 | 31.6 |
| C | 3 | 111 | 9978 | 311.18 | 140 | 136 | 31.6 |
| D | 12 | 22 | 124983 | 3798.05 | 142 | 137 | 32.9 |
| D | 2 | 253 | 41668 | 1263.45 | 142 | 137 | 32.9 |
| D | 10 | 166 | 18435 | 556.66 | 142 | 137 | 32.9 |
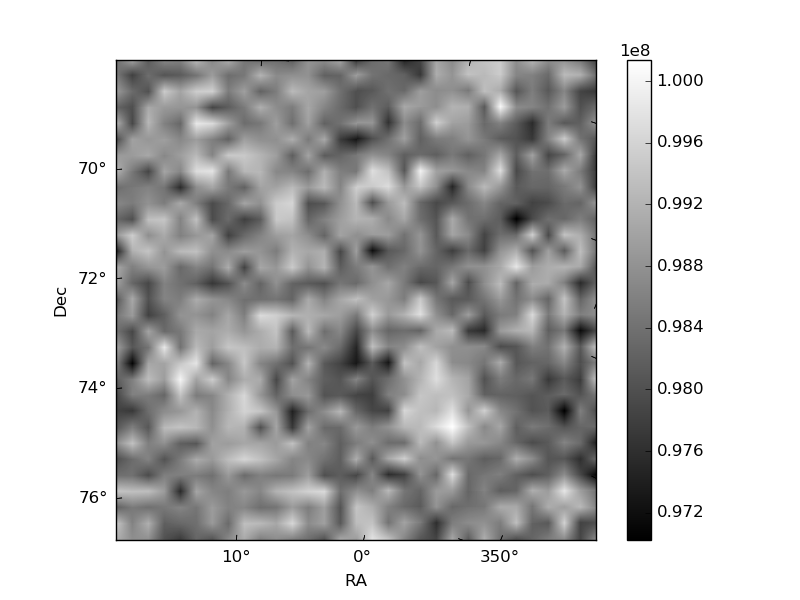
Histogram calculated using DETX and DETY for each event in the final _common_clean file
| Quadrant A |  |
 |
Quadrant B |
|---|---|---|---|
| Quadrant D |  |
 |
Quadrant C |
| Plot type | Count rate plots | Images |
|---|---|---|
| Comparison with Poisson distribution Blue bars denote a histogram of data divided into 1 sec bins. Red curve is a Poisson curve with rate = median count rate of data. |
 |
 |
| Quadrant-wise count rates Data is divided into 100 sec bins |
 |
|
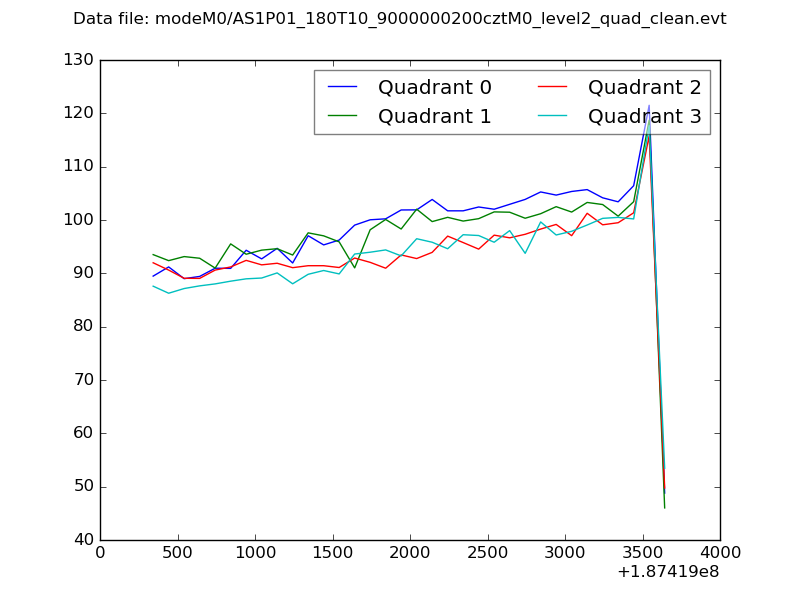
| Module-wise count rates for Quadrant A Data is divided into 100 sec bins |
 |
 |
| Module-wise count rates for Quadrant B Data is divided into 100 sec bins |
 |
 |
| Module-wise count rates for Quadrant C Data is divided into 100 sec bins |
 |
 |
| Module-wise count rates for Quadrant D Data is divided into 100 sec bins |
 |
 |
| Parameter | Plot |
|---|---|
| CZT HV Monitor | 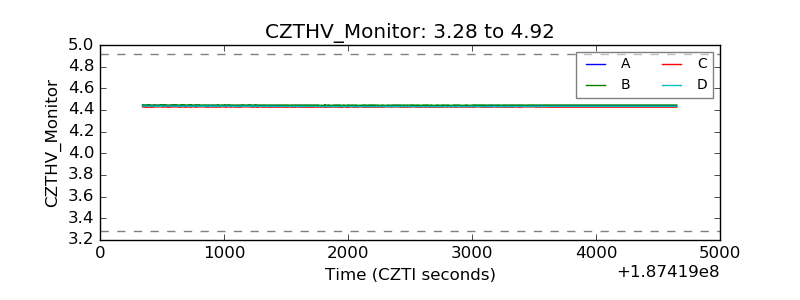 |
| D_VDD |  |
| Temperature 1 |  |
| Veto HV Monitor |  |
| Veto LLD | 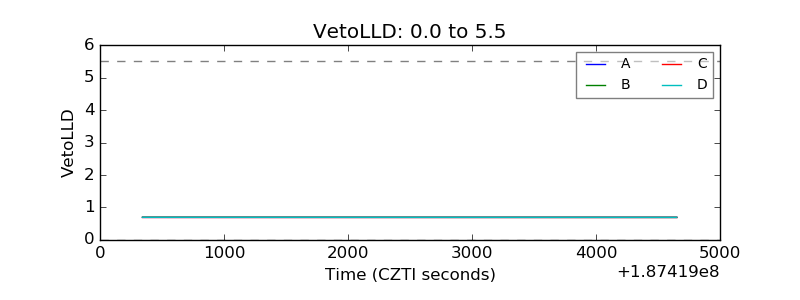 |
| Alpha Counter | 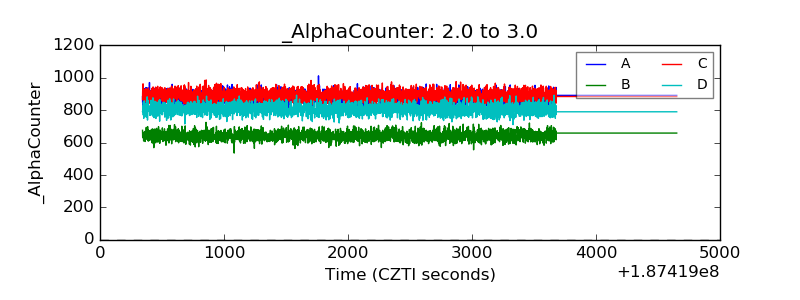 |
| _CPM_Rate |  |
| CZT Counter |  |
| +2.5 Volts monitor | 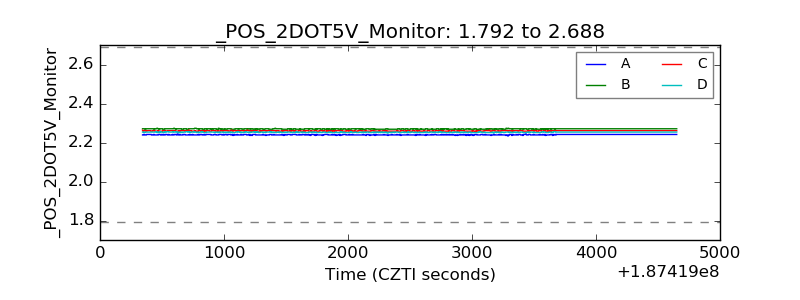 |
| +5 Volts monitor |  |
| _ROLL_ROT |  |
| _Roll_DEC |  |
| _Roll_RA |  |
| Veto Counter |  |