| Param | Original file | Final file |
|---|---|---|
| Filename | modeM0/AS1P01_180T10_9000000196cztM0_level2_bc.evt | modeM0/AS1P01_180T10_9000000196cztM0_level2_quad_clean.evt |
| Size (bytes) | 111,493,440 | 49,737,600 |
| Size | 106.3 MB | 47.4 MB |
| Events in quadrant A | 581,960 | 332,911 |
| Events in quadrant B | 1,150,561 | 309,735 |
| Events in quadrant C | 751,053 | 313,043 |
| Events in quadrant D | 659,647 | 315,681 |
| Mode M9 | |||
|---|---|---|---|
| Quadrant | BADHDUFLAG | Total packets | Discarded packets |
| A | 0 | 11 | 0 |
| B | 0 | 11 | 0 |
| C | 0 | 11 | 0 |
| D | 0 | 11 | 0 |
| Mode M0 | |||
|---|---|---|---|
| Quadrant | BADHDUFLAG | Total packets | Discarded packets |
| A | 0 | 14074 | 1 |
| B | 0 | 16240 | 1 |
| C | 0 | 14127 | 1 |
| D | 0 | 13369 | 1 |
| Mode SS | |||
|---|---|---|---|
| Quadrant | BADHDUFLAG | Total packets | Discarded packets |
| A | 0 | 68 | 0 |
| B | 0 | 68 | 0 |
| C | 0 | 68 | 0 |
| D | 0 | 68 | 0 |
| Quadrant | Total seconds | Saturated seconds | Saturation percentage |
|---|---|---|---|
| A | 3304 | 3 | 0.090799% |
| B | 3304 | 216 | 6.537530% |
| C | 3304 | 3 | 0.090799% |
| D | 3304 | 3 | 0.090799% |
Noise dominated data is calculated using 1-second bins in cleaned event files. If a bin has >2000 counts, and if more than 50% of those come from <1% of pixels, then it is considered to be noise-dominated and hence unusable.
| Quadrant | # 1 sec bins | Bins with >0 counts | Bins with >2000 counts | High rate bins dominated by noise | Noise dominated (total time) | Noise dominated (detector-on time) | Marked lightcurve |
|---|---|---|---|---|---|---|---|
| A | 4388 | 3303 | 0 | 0 | 0.00% | 0.00% |  |
| B | 4389 | 3304 | 76 | 76 | 1.73% | 2.30% | 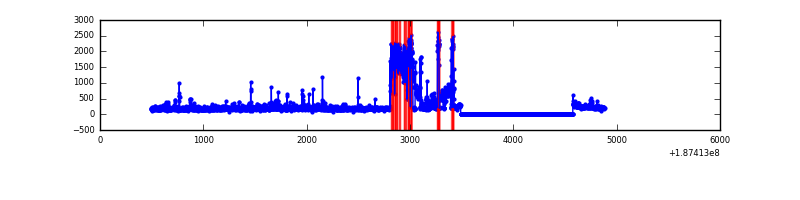 |
| C | 4389 | 3304 | 0 | 0 | 0.00% | 0.00% |  |
| D | 4389 | 3304 | 0 | 0 | 0.00% | 0.00% |  |
Top three noisy pixels from each quadrant. If the there are fewer than three noisy pixels in the level2.evt file, extra rows are filled as -1
| Pixel properties | Quadrant properties | ||||||
|---|---|---|---|---|---|---|---|
| Quadrant | DetID | PixID | Counts | Sigma | Mean | Median | Sigma |
| A | 8 | 255 | 1864 | 49.69 | 150 | 146 | 34.6 |
| A | 13 | 9 | 1567 | 41.1 | 150 | 146 | 34.6 |
| A | 13 | 235 | 854 | 20.48 | 150 | 146 | 34.6 |
| B | 5 | 191 | 518970 | 18379.41 | 143 | 140 | 28.2 |
| B | 15 | 22 | 45871 | 1620.01 | 143 | 140 | 28.2 |
| B | 5 | 249 | 10042 | 350.78 | 143 | 140 | 28.2 |
| C | 15 | 241 | 152359 | 4678.72 | 143 | 140 | 32.5 |
| C | 3 | 79 | 19711 | 601.55 | 143 | 140 | 32.5 |
| C | 3 | 111 | 9335 | 282.62 | 143 | 140 | 32.5 |
| D | 2 | 216 | 32509 | 939.13 | 145 | 141 | 34.5 |
| D | 13 | 169 | 17341 | 499.04 | 145 | 141 | 34.5 |
| D | 15 | 13 | 12869 | 369.29 | 145 | 141 | 34.5 |
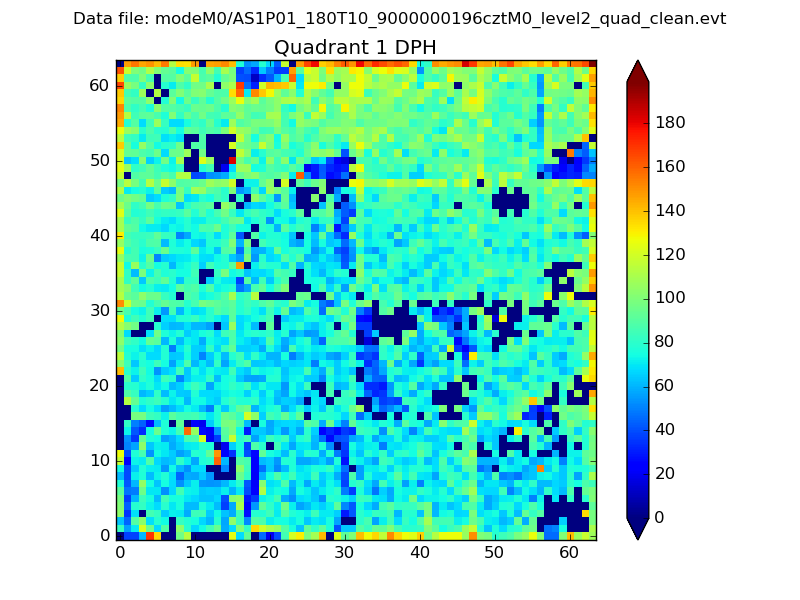
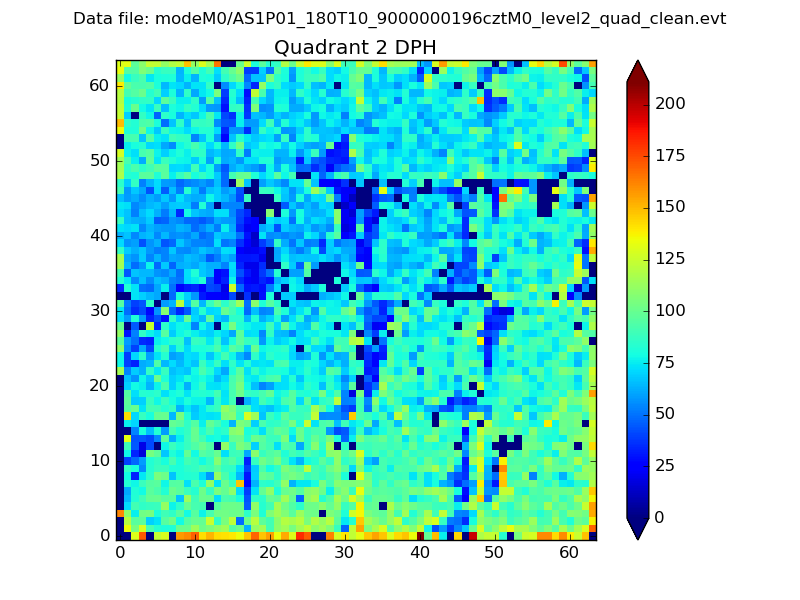
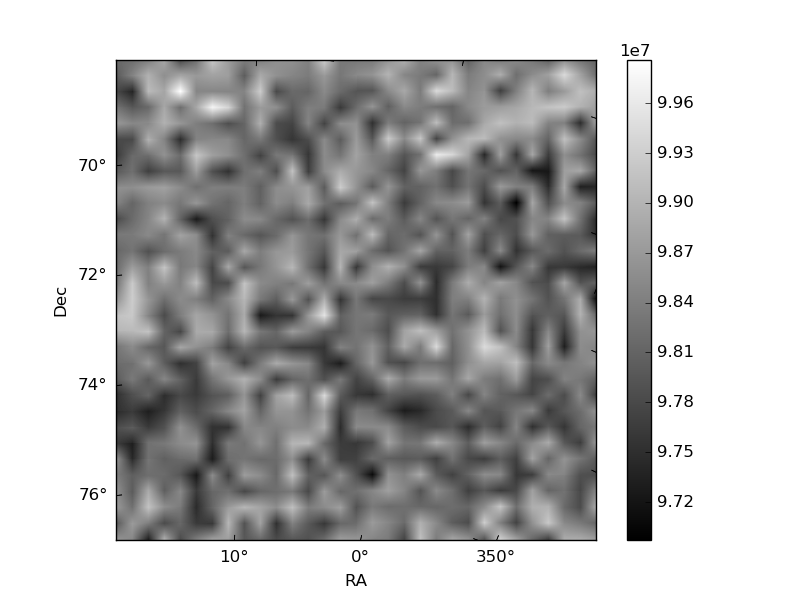
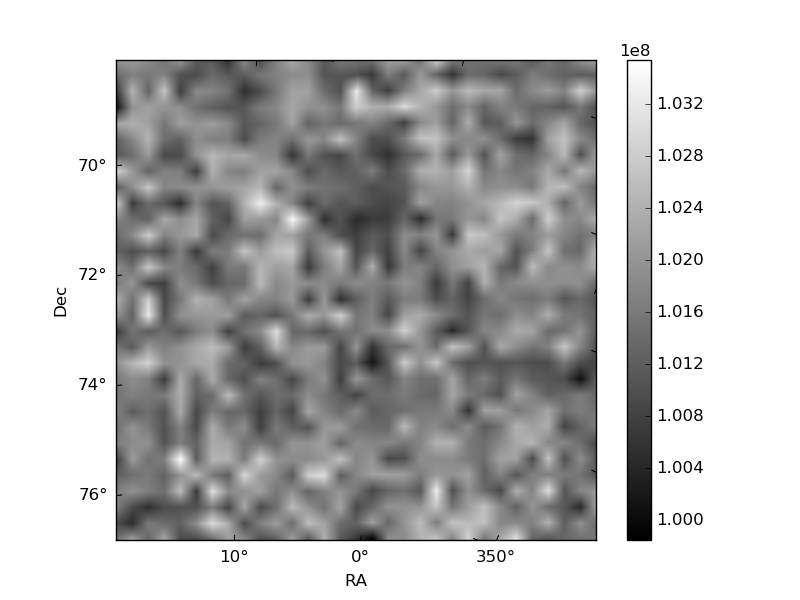
Histogram calculated using DETX and DETY for each event in the final _common_clean file
| Quadrant A |  |
 |
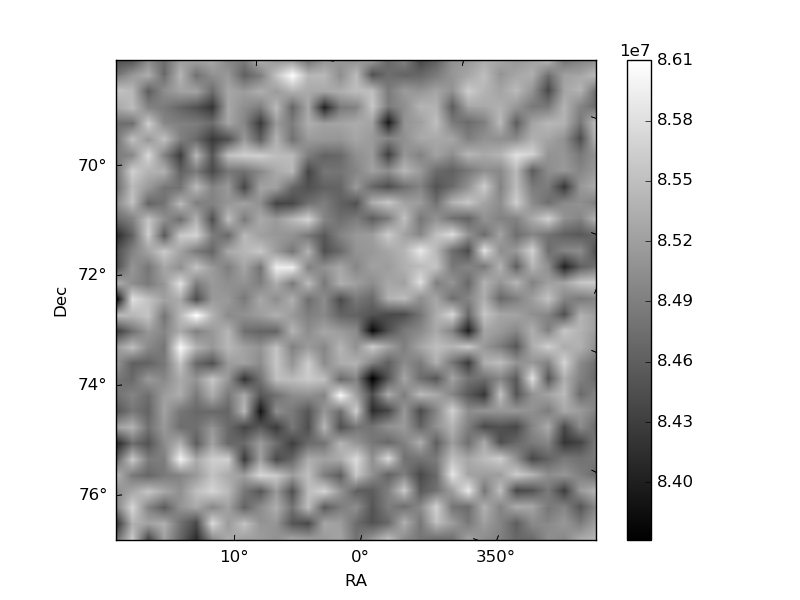
Quadrant B |
|---|---|---|---|
| Quadrant D |  |
 |
Quadrant C |
| Plot type | Count rate plots | Images |
|---|---|---|
| Comparison with Poisson distribution Blue bars denote a histogram of data divided into 1 sec bins. Red curve is a Poisson curve with rate = median count rate of data. |
 |
 |
| Quadrant-wise count rates Data is divided into 100 sec bins |
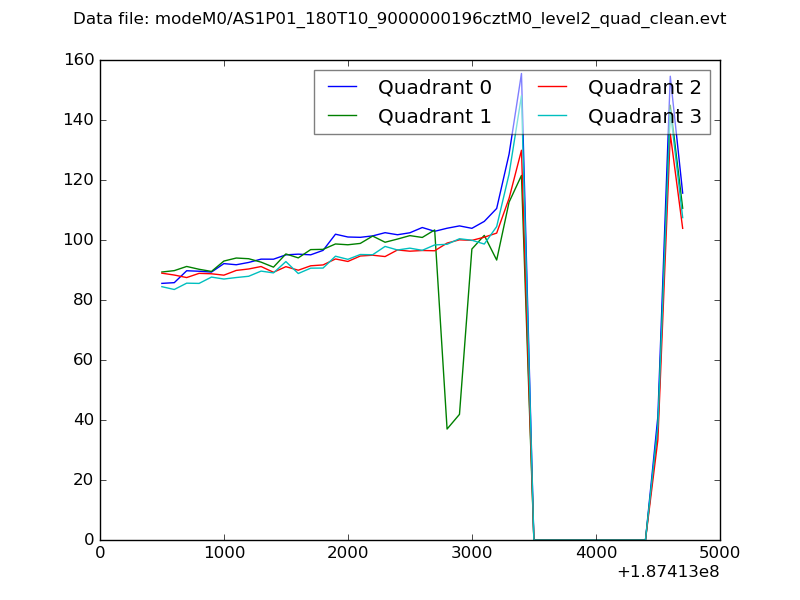 |
|
| Module-wise count rates for Quadrant A Data is divided into 100 sec bins |
 |
 |
| Module-wise count rates for Quadrant B Data is divided into 100 sec bins |
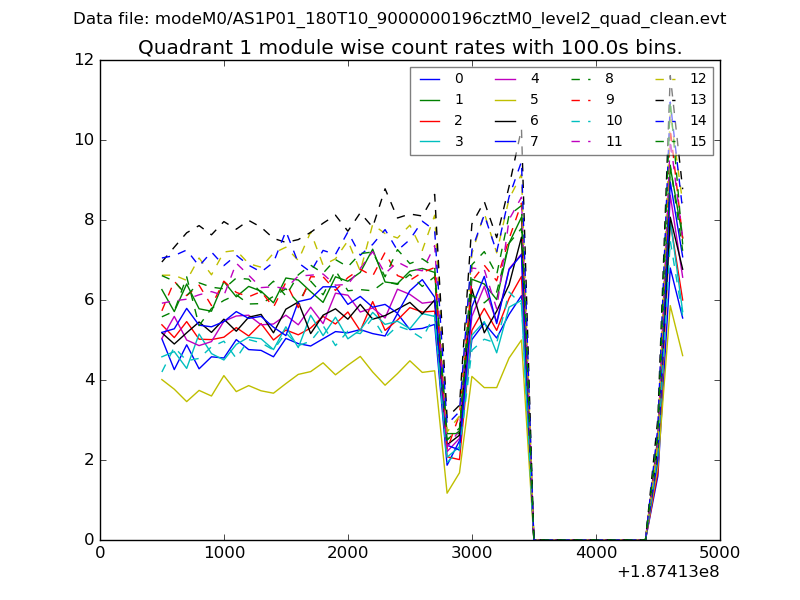 |
 |
| Module-wise count rates for Quadrant C Data is divided into 100 sec bins |
 |
 |
| Module-wise count rates for Quadrant D Data is divided into 100 sec bins |
 |
 |
| Parameter | Plot |
|---|---|
| CZT HV Monitor | 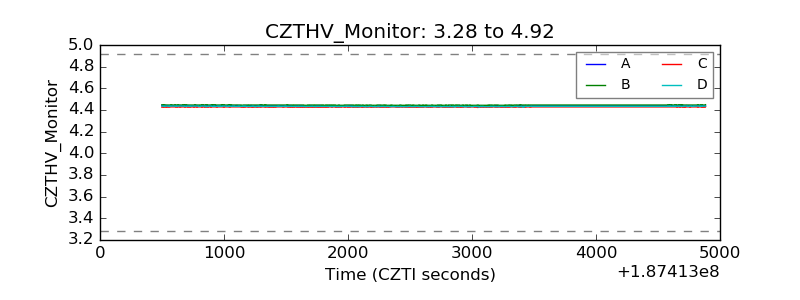 |
| D_VDD |  |
| Temperature 1 |  |
| Veto HV Monitor | 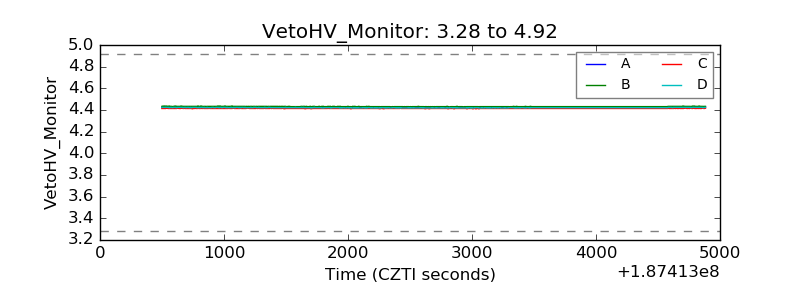 |
| Veto LLD |  |
| Alpha Counter | 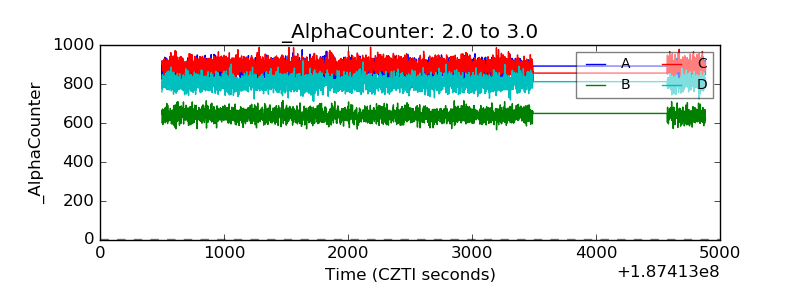 |
| _CPM_Rate |  |
| CZT Counter |  |
| +2.5 Volts monitor |  |
| +5 Volts monitor |  |
| _ROLL_ROT |  |
| _Roll_DEC |  |
| _Roll_RA | 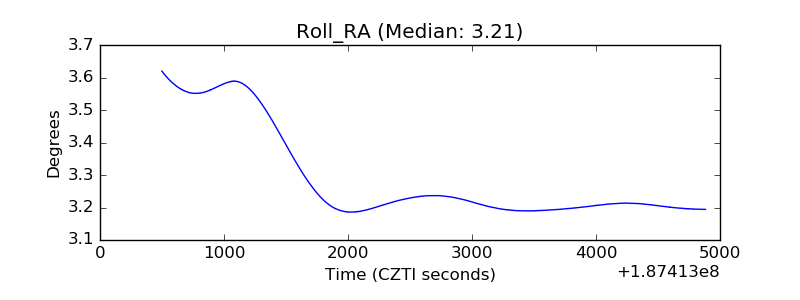 |
| Veto Counter | 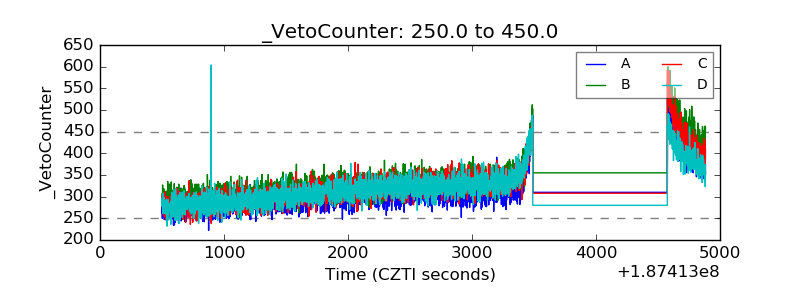 |