| Param | Original file | Final file |
|---|---|---|
| Filename | modeM0/AS1P01_163T03_9000000186cztM0_level2.evt | modeM0/AS1P01_163T03_9000000186cztM0_level2_quad_clean.evt |
| Size (bytes) | 11,181,913,920 | 1,029,568,320 |
| Size | 10.4 GB | 981.9 MB |
| Events in quadrant A | 83,947,574 | 6,688,875 |
| Events in quadrant B | 87,821,331 | 6,776,267 |
| Events in quadrant C | 84,357,267 | 6,577,617 |
| Events in quadrant D | 77,987,459 | 6,420,550 |
| Mode SS | |||
|---|---|---|---|
| Quadrant | BADHDUFLAG | Total packets | Discarded packets |
| A | 0 | 1400 | 0 |
| B | 0 | 1400 | 0 |
| C | 0 | 1400 | 0 |
| D | 0 | 1400 | 0 |
| Mode M0 | |||
|---|---|---|---|
| Quadrant | BADHDUFLAG | Total packets | Discarded packets |
| A | 0 | 298321 | 0 |
| B | 0 | 309823 | 0 |
| C | 0 | 299677 | 0 |
| D | 0 | 280898 | 0 |
| Mode M9 | |||
|---|---|---|---|
| Quadrant | BADHDUFLAG | Total packets | Discarded packets |
| A | 0 | 102 | 0 |
| B | 0 | 102 | 0 |
| C | 0 | 102 | 0 |
| D | 0 | 102 | 0 |
| Quadrant | Total seconds | Saturated seconds | Saturation percentage |
|---|---|---|---|
| A | 68896 | 695 | 1.008767% |
| B | 68894 | 775 | 1.124917% |
| C | 68894 | 1060 | 1.538596% |
| D | 68895 | 748 | 1.085710% |
Noise dominated data is calculated using 1-second bins in cleaned event files. If a bin has >2000 counts, and if more than 50% of those come from <1% of pixels, then it is considered to be noise-dominated and hence unusable.
| Quadrant | # 1 sec bins | Bins with >0 counts | Bins with >2000 counts | High rate bins dominated by noise | Noise dominated (total time) | Noise dominated (detector-on time) | Marked lightcurve |
|---|---|---|---|---|---|---|---|
| A | 78936 | 68909 | 3458 | 3458 | 4.38% | 5.02% |  |
| B | 78936 | 68908 | 3694 | 3694 | 4.68% | 5.36% |  |
| C | 78936 | 68908 | 3255 | 3255 | 4.12% | 4.72% | 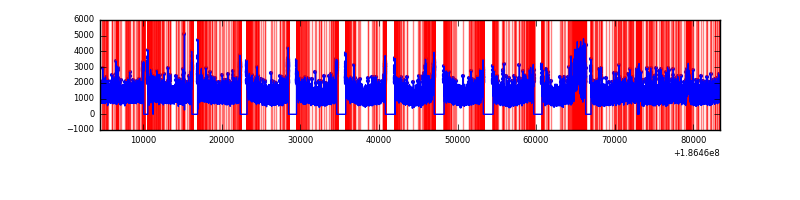 |
| D | 78936 | 68909 | 2701 | 2701 | 3.42% | 3.92% | 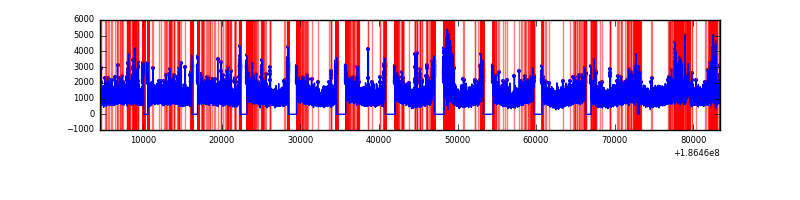 |
Top three noisy pixels from each quadrant. If the there are fewer than three noisy pixels in the level2.evt file, extra rows are filled as -1
| Pixel properties | Quadrant properties | ||||||
|---|---|---|---|---|---|---|---|
| Quadrant | DetID | PixID | Counts | Sigma | Mean | Median | Sigma |
| A | 14 | 170 | 2572289 | 506.36 | 21092 | 21217 | 5038.1 |
| A | 15 | 233 | 253173 | 46.04 | 21092 | 21217 | 5038.1 |
| A | 13 | 17 | 111269 | 17.87 | 21092 | 21217 | 5038.1 |
| B | 3 | 0 | 1033911 | 196.64 | 22089 | 22172 | 5145.2 |
| B | 7 | 221 | 599113 | 112.13 | 22089 | 22172 | 5145.2 |
| B | 5 | 191 | 410669 | 75.51 | 22089 | 22172 | 5145.2 |
| C | 15 | 241 | 3419334 | 610.04 | 20000 | 20686 | 5571.2 |
| C | 9 | 83 | 1836826 | 325.99 | 20000 | 20686 | 5571.2 |
| C | 9 | 144 | 419016 | 71.5 | 20000 | 20686 | 5571.2 |
| D | 12 | 188 | 3073422 | 511.26 | 19378 | 20077 | 5972.2 |
| D | 1 | 4 | 1234931 | 203.42 | 19378 | 20077 | 5972.2 |
| D | 13 | 171 | 300487 | 46.95 | 19378 | 20077 | 5972.2 |
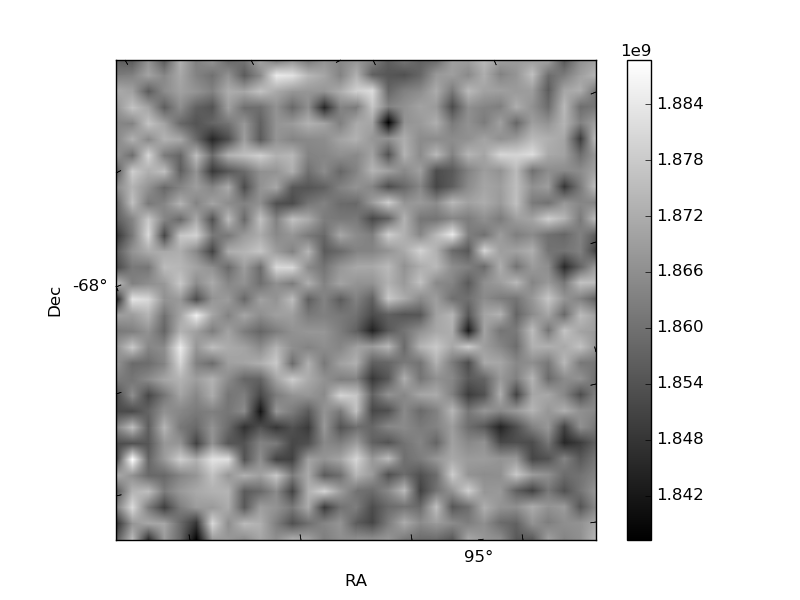
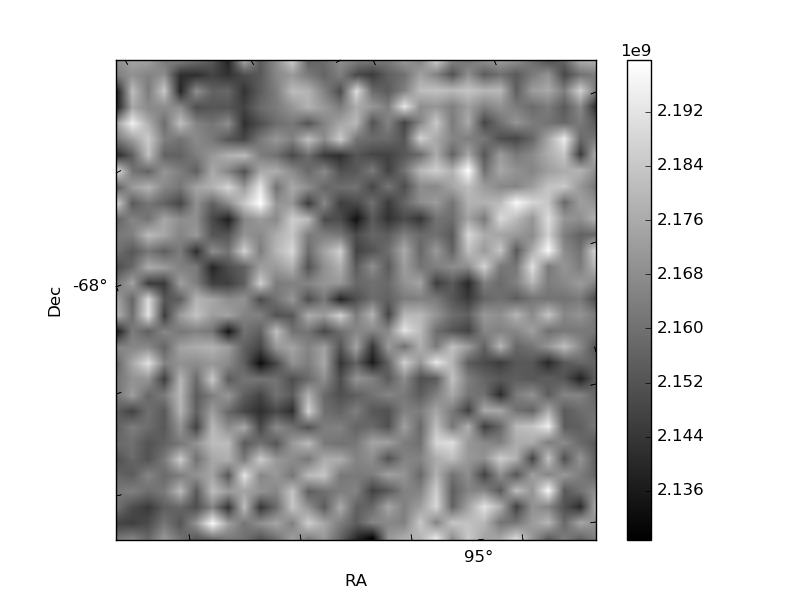
Histogram calculated using DETX and DETY for each event in the final _common_clean file
| Quadrant A |  |
 |
Quadrant B |
|---|---|---|---|
| Quadrant D |  |
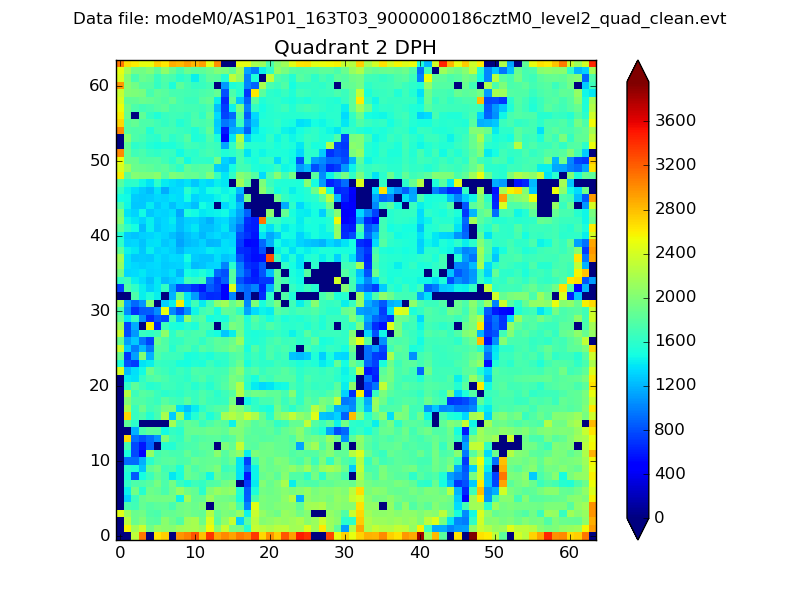 |
Quadrant C |
| Plot type | Count rate plots | Images |
|---|---|---|
| Comparison with Poisson distribution Blue bars denote a histogram of data divided into 1 sec bins. Red curve is a Poisson curve with rate = median count rate of data. |
 |
 |
| Quadrant-wise count rates Data is divided into 100 sec bins |
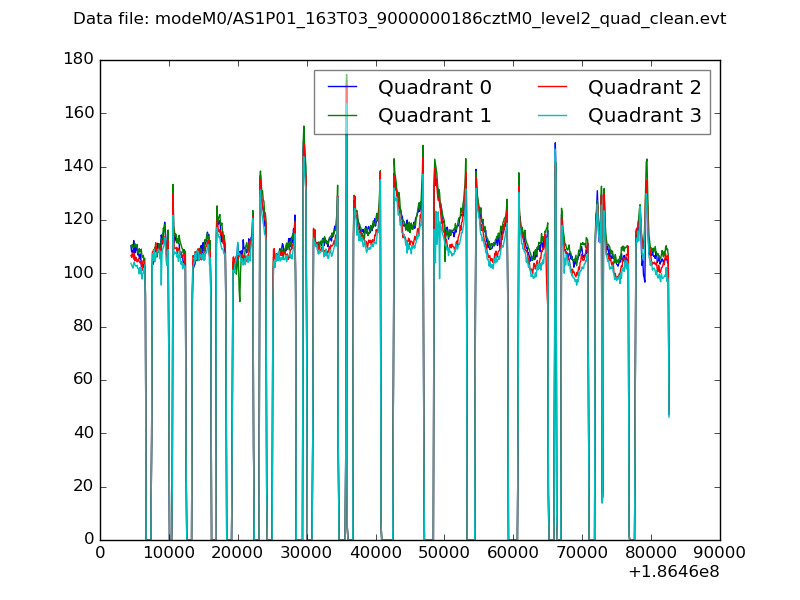 |
|
| Module-wise count rates for Quadrant A Data is divided into 100 sec bins |
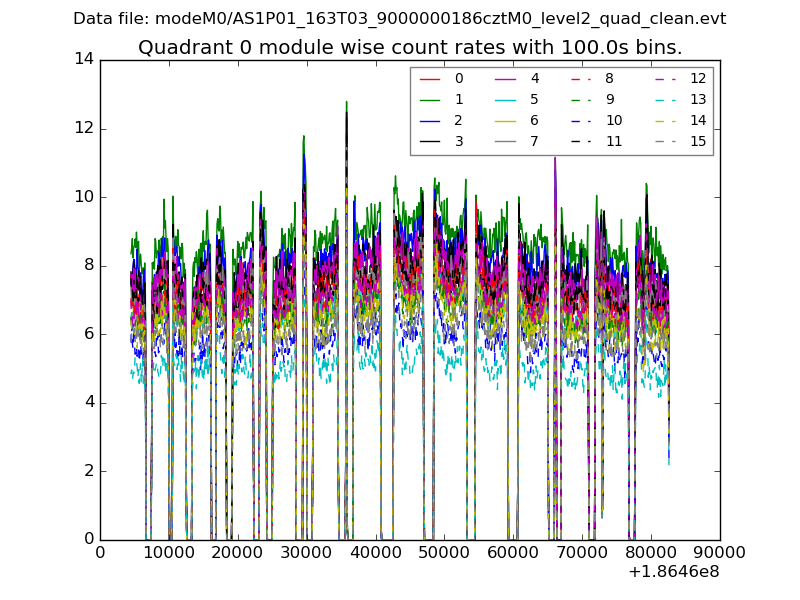 |
 |
| Module-wise count rates for Quadrant B Data is divided into 100 sec bins |
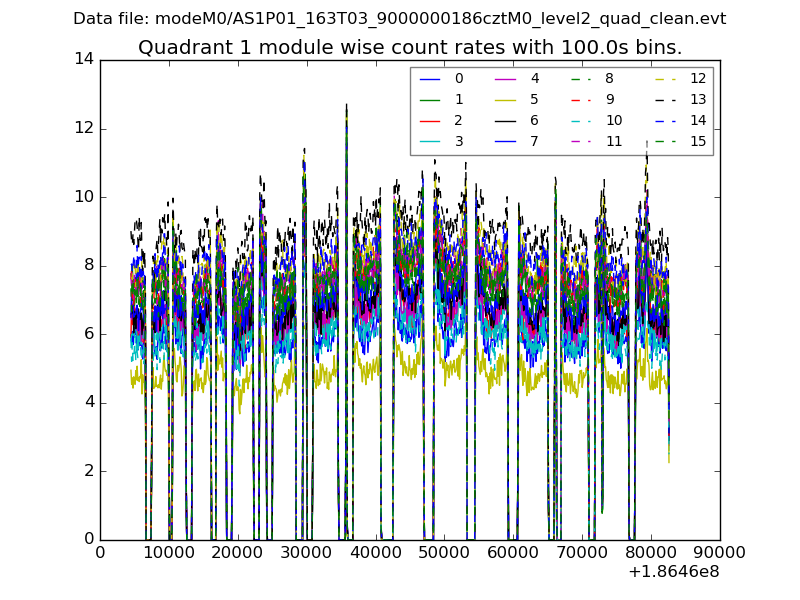 |
 |
| Module-wise count rates for Quadrant C Data is divided into 100 sec bins |
 |
 |
| Module-wise count rates for Quadrant D Data is divided into 100 sec bins |
 |
 |
| Parameter | Plot |
|---|---|
| CZT HV Monitor |  |
| D_VDD |  |
| Temperature 1 |  |
| Veto HV Monitor |  |
| Veto LLD |  |
| Alpha Counter |  |
| _CPM_Rate |  |
| CZT Counter | 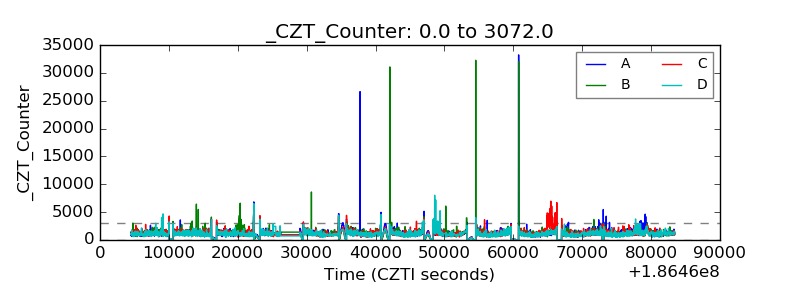 |
| +2.5 Volts monitor | 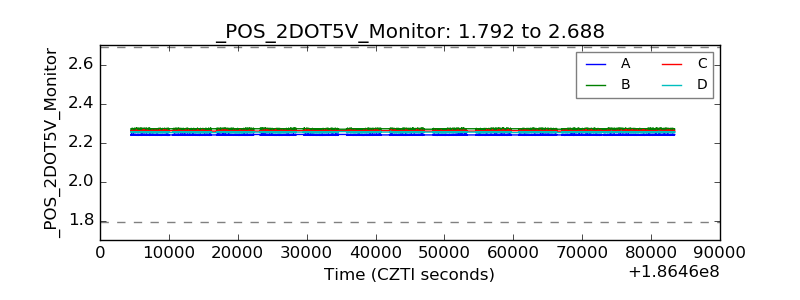 |
| +5 Volts monitor |  |
| _ROLL_ROT |  |
| _Roll_DEC | 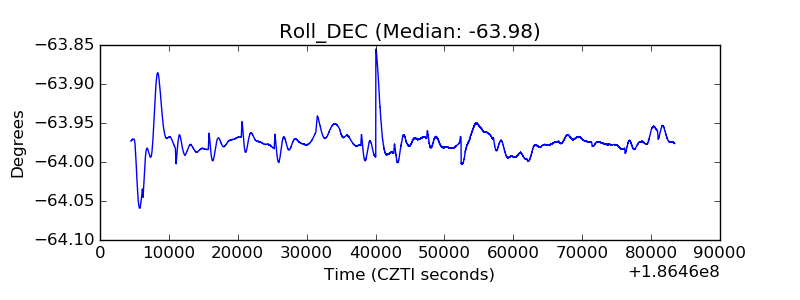 |
| _Roll_RA |  |
| Veto Counter |  |