| Param | Original file | Final file |
|---|---|---|
| Filename | modeM0/AS1P01_165T08_9000000182cztM0_level2_bc.evt | modeM0/AS1P01_165T08_9000000182cztM0_level2_quad_clean.evt |
| Size (bytes) | 845,000,640 | 331,796,160 |
| Size | 805.9 MB | 316.4 MB |
| Events in quadrant A | 3,890,631 | 2,223,345 |
| Events in quadrant B | 8,934,178 | 2,044,121 |
| Events in quadrant C | 5,873,366 | 2,133,452 |
| Events in quadrant D | 5,346,812 | 2,093,243 |
| Mode M0 | |||
|---|---|---|---|
| Quadrant | BADHDUFLAG | Total packets | Discarded packets |
| A | 0 | 94982 | 0 |
| B | 0 | 124389 | 0 |
| C | 0 | 98844 | 0 |
| D | 0 | 92036 | 0 |
| Mode M9 | |||
|---|---|---|---|
| Quadrant | BADHDUFLAG | Total packets | Discarded packets |
| A | 0 | 30 | 0 |
| B | 0 | 30 | 0 |
| C | 0 | 30 | 0 |
| D | 0 | 30 | 0 |
| Mode SS | |||
|---|---|---|---|
| Quadrant | BADHDUFLAG | Total packets | Discarded packets |
| A | 0 | 458 | 0 |
| B | 0 | 458 | 0 |
| C | 0 | 458 | 0 |
| D | 0 | 458 | 0 |
| Quadrant | Total seconds | Saturated seconds | Saturation percentage |
|---|---|---|---|
| A | 22599 | 78 | 0.345148% |
| B | 22599 | 2707 | 11.978406% |
| C | 22599 | 67 | 0.296473% |
| D | 22599 | 99 | 0.438072% |
Noise dominated data is calculated using 1-second bins in cleaned event files. If a bin has >2000 counts, and if more than 50% of those come from <1% of pixels, then it is considered to be noise-dominated and hence unusable.
| Quadrant | # 1 sec bins | Bins with >0 counts | Bins with >2000 counts | High rate bins dominated by noise | Noise dominated (total time) | Noise dominated (detector-on time) | Marked lightcurve |
|---|---|---|---|---|---|---|---|
| A | 25519 | 22599 | 0 | 0 | 0.00% | 0.00% |  |
| B | 25519 | 22597 | 84 | 84 | 0.33% | 0.37% |  |
| C | 25519 | 22599 | 4 | 4 | 0.02% | 0.02% |  |
| D | 25519 | 22599 | 5 | 5 | 0.02% | 0.02% | 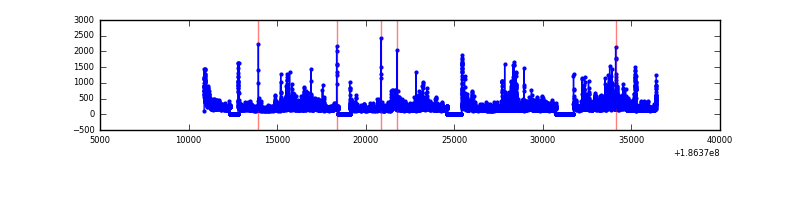 |
Top three noisy pixels from each quadrant. If the there are fewer than three noisy pixels in the level2.evt file, extra rows are filled as -1
| Pixel properties | Quadrant properties | ||||||
|---|---|---|---|---|---|---|---|
| Quadrant | DetID | PixID | Counts | Sigma | Mean | Median | Sigma |
| A | 15 | 127 | 84419 | 403.58 | 980 | 957 | 206.8 |
| A | 12 | 189 | 20391 | 93.97 | 980 | 957 | 206.8 |
| A | 15 | 233 | 6705 | 27.79 | 980 | 957 | 206.8 |
| B | 3 | 0 | 4391238 | 26174.63 | 927 | 898 | 167.7 |
| B | 0 | 220 | 184298 | 1093.41 | 927 | 898 | 167.7 |
| B | 5 | 249 | 168442 | 998.88 | 927 | 898 | 167.7 |
| C | 9 | 83 | 1787341 | 8972.99 | 948 | 928 | 199.1 |
| C | 15 | 241 | 168355 | 840.97 | 948 | 928 | 199.1 |
| C | 3 | 111 | 50617 | 249.58 | 948 | 928 | 199.1 |
| D | 12 | 188 | 932332 | 4532.5 | 945 | 915 | 205.5 |
| D | 1 | 4 | 207671 | 1006.12 | 945 | 915 | 205.5 |
| D | 2 | 16 | 189570 | 918.04 | 945 | 915 | 205.5 |
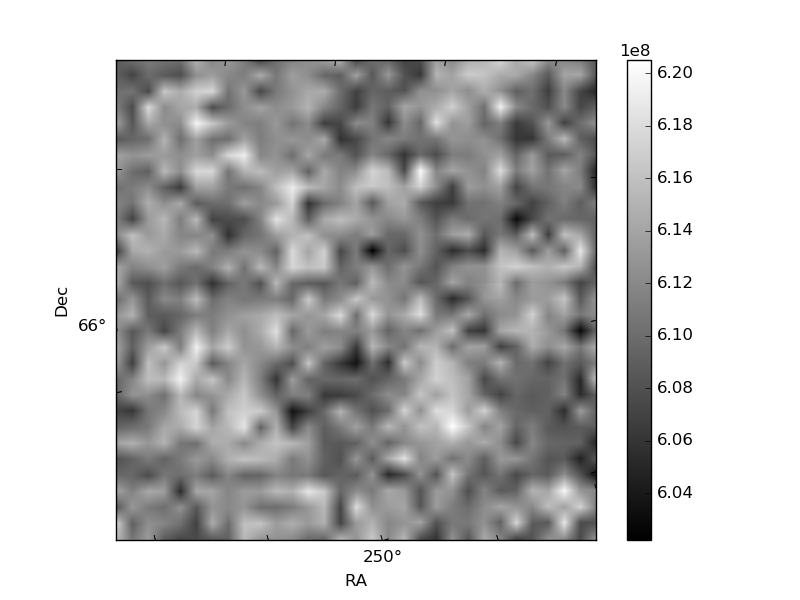
Histogram calculated using DETX and DETY for each event in the final _common_clean file
| Quadrant A |  |
 |
Quadrant B |
|---|---|---|---|
| Quadrant D |  |
 |
Quadrant C |
| Plot type | Count rate plots | Images |
|---|---|---|
| Comparison with Poisson distribution Blue bars denote a histogram of data divided into 1 sec bins. Red curve is a Poisson curve with rate = median count rate of data. |
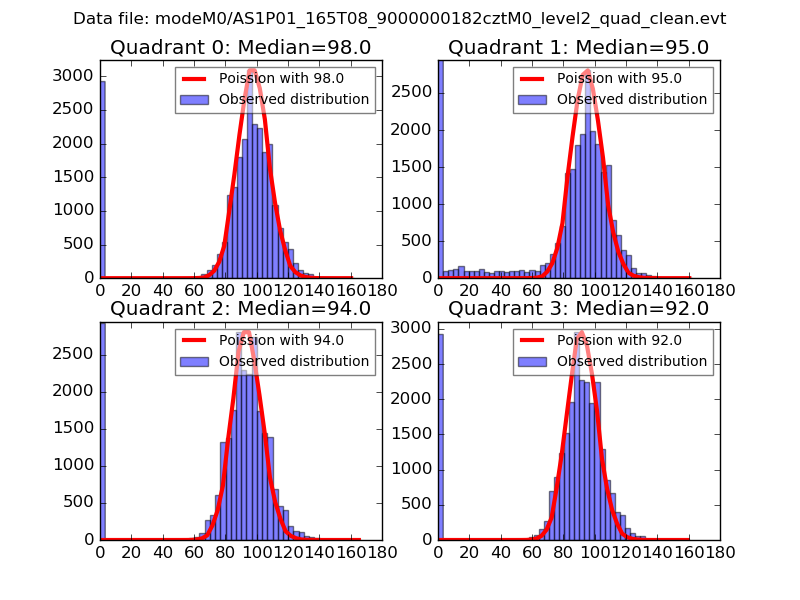 |
 |
| Quadrant-wise count rates Data is divided into 100 sec bins |
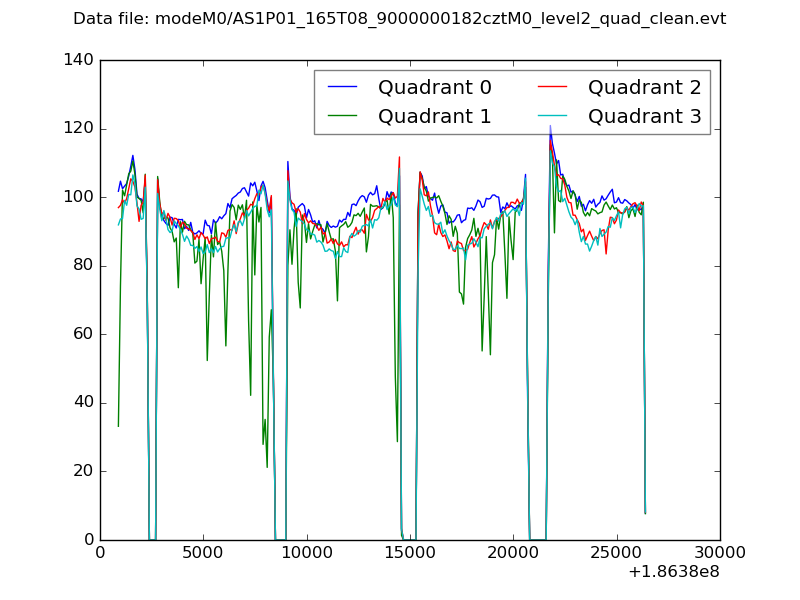 |
|
| Module-wise count rates for Quadrant A Data is divided into 100 sec bins |
 |
 |
| Module-wise count rates for Quadrant B Data is divided into 100 sec bins |
 |
 |
| Module-wise count rates for Quadrant C Data is divided into 100 sec bins |
 |
 |
| Module-wise count rates for Quadrant D Data is divided into 100 sec bins |
 |
 |
| Parameter | Plot |
|---|---|
| CZT HV Monitor |  |
| D_VDD |  |
| Temperature 1 |  |
| Veto HV Monitor |  |
| Veto LLD |  |
| Alpha Counter |  |
| _CPM_Rate |  |
| CZT Counter |  |
| +2.5 Volts monitor |  |
| +5 Volts monitor |  |
| _ROLL_ROT |  |
| _Roll_DEC |  |
| _Roll_RA |  |
| Veto Counter |  |