| Param | Original file | Final file |
|---|---|---|
| Filename | modeM0/AS1P01_161T02_9000000184cztM0_level2.evt | modeM0/AS1P01_161T02_9000000184cztM0_level2_quad_clean.evt |
| Size (bytes) | 7,485,004,800 | 580,420,800 |
| Size | 7.0 GB | 553.5 MB |
| Events in quadrant A | 53,512,146 | 3,697,223 |
| Events in quadrant B | 58,015,632 | 3,733,300 |
| Events in quadrant C | 53,652,884 | 3,670,481 |
| Events in quadrant D | 58,594,775 | 3,441,694 |
| Mode SS | |||
|---|---|---|---|
| Quadrant | BADHDUFLAG | Total packets | Discarded packets |
| A | 0 | 894 | 0 |
| B | 0 | 894 | 0 |
| C | 0 | 894 | 0 |
| D | 0 | 894 | 0 |
| Mode M0 | |||
|---|---|---|---|
| Quadrant | BADHDUFLAG | Total packets | Discarded packets |
| A | 0 | 190536 | 0 |
| B | 0 | 203762 | 0 |
| C | 0 | 190760 | 0 |
| D | 0 | 205895 | 0 |
| Mode M9 | |||
|---|---|---|---|
| Quadrant | BADHDUFLAG | Total packets | Discarded packets |
| A | 0 | 68 | 0 |
| B | 0 | 68 | 0 |
| C | 0 | 68 | 0 |
| D | 0 | 68 | 0 |
| Quadrant | Total seconds | Saturated seconds | Saturation percentage |
|---|---|---|---|
| A | 44246 | 751 | 1.697329% |
| B | 44246 | 612 | 1.383176% |
| C | 44247 | 266 | 0.601171% |
| D | 44247 | 2500 | 5.650101% |
Noise dominated data is calculated using 1-second bins in cleaned event files. If a bin has >2000 counts, and if more than 50% of those come from <1% of pixels, then it is considered to be noise-dominated and hence unusable.
| Quadrant | # 1 sec bins | Bins with >0 counts | Bins with >2000 counts | High rate bins dominated by noise | Noise dominated (total time) | Noise dominated (detector-on time) | Marked lightcurve |
|---|---|---|---|---|---|---|---|
| A | 55039 | 44253 | 2256 | 2256 | 4.10% | 5.10% | 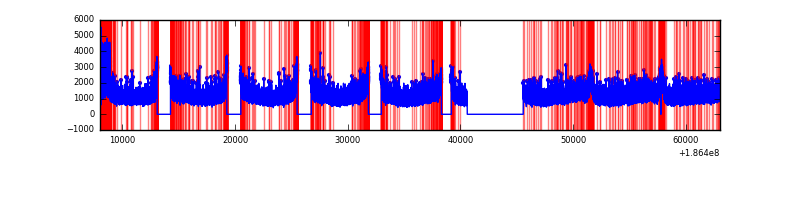 |
| B | 55039 | 44253 | 3238 | 3238 | 5.88% | 7.32% |  |
| C | 55039 | 44254 | 1803 | 1803 | 3.28% | 4.07% |  |
| D | 55039 | 44254 | 5544 | 5544 | 10.07% | 12.53% |  |
Top three noisy pixels from each quadrant. If the there are fewer than three noisy pixels in the level2.evt file, extra rows are filled as -1
| Pixel properties | Quadrant properties | ||||||
|---|---|---|---|---|---|---|---|
| Quadrant | DetID | PixID | Counts | Sigma | Mean | Median | Sigma |
| A | 15 | 233 | 1586412 | 493.6 | 13373 | 13465 | 3186.7 |
| A | 15 | 127 | 616823 | 189.34 | 13373 | 13465 | 3186.7 |
| A | 11 | 79 | 53053 | 12.42 | 13373 | 13465 | 3186.7 |
| B | 3 | 0 | 2893571 | 879.49 | 14061 | 14105 | 3274.0 |
| B | 7 | 221 | 340387 | 99.66 | 14061 | 14105 | 3274.0 |
| B | 5 | 249 | 253080 | 72.99 | 14061 | 14105 | 3274.0 |
| C | 15 | 241 | 1617184 | 447.85 | 12922 | 13366 | 3581.1 |
| C | 9 | 83 | 801103 | 219.97 | 12922 | 13366 | 3581.1 |
| C | 3 | 111 | 183504 | 47.51 | 12922 | 13366 | 3581.1 |
| D | 12 | 188 | 10114655 | 2694.03 | 12228 | 12686 | 3749.8 |
| D | 1 | 4 | 1510415 | 399.42 | 12228 | 12686 | 3749.8 |
| D | 13 | 73 | 344322 | 88.44 | 12228 | 12686 | 3749.8 |
Histogram calculated using DETX and DETY for each event in the final _common_clean file
| Quadrant A |  |
 |
Quadrant B |
|---|---|---|---|
| Quadrant D |  |
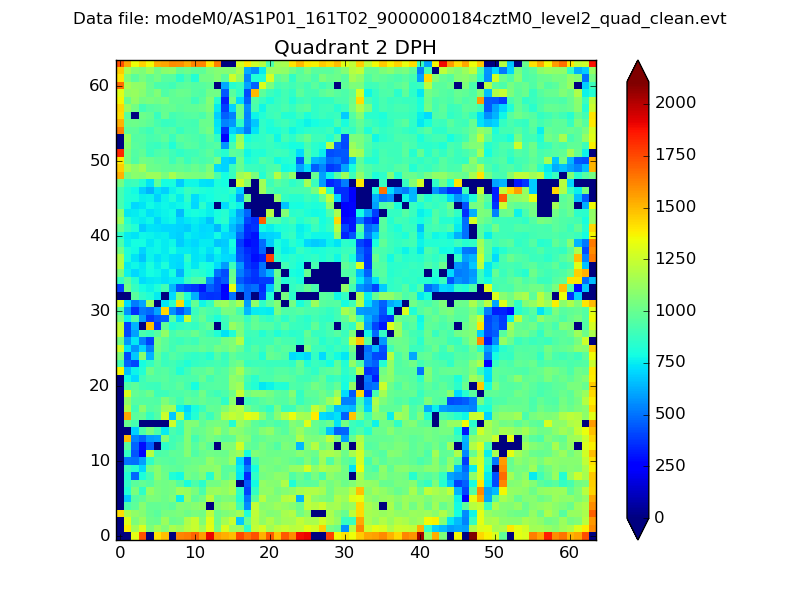 |
Quadrant C |
| Plot type | Count rate plots | Images |
|---|---|---|
| Comparison with Poisson distribution Blue bars denote a histogram of data divided into 1 sec bins. Red curve is a Poisson curve with rate = median count rate of data. |
 |
 |
| Quadrant-wise count rates Data is divided into 100 sec bins |
 |
|
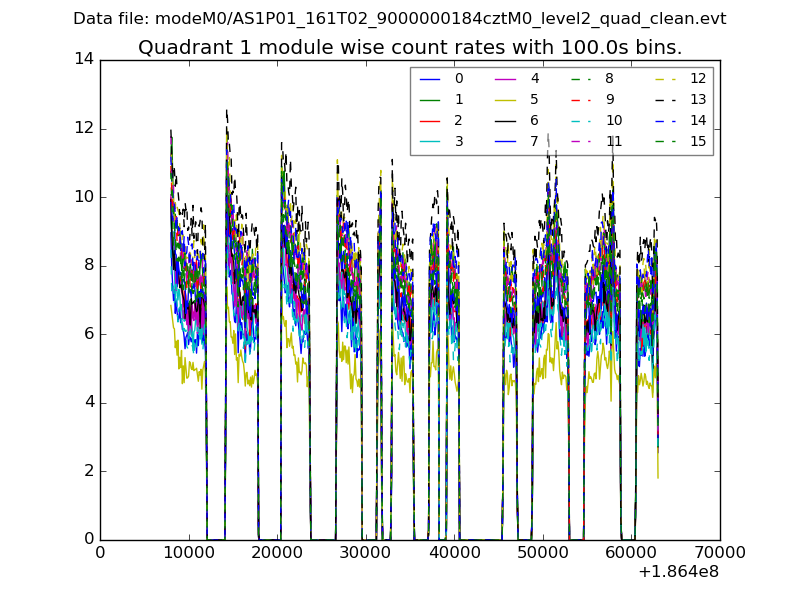
| Module-wise count rates for Quadrant A Data is divided into 100 sec bins |
 |
 |
| Module-wise count rates for Quadrant B Data is divided into 100 sec bins |
 |
 |
| Module-wise count rates for Quadrant C Data is divided into 100 sec bins |
 |
 |
| Module-wise count rates for Quadrant D Data is divided into 100 sec bins |
 |
 |
| Parameter | Plot |
|---|---|
| CZT HV Monitor |  |
| D_VDD |  |
| Temperature 1 | 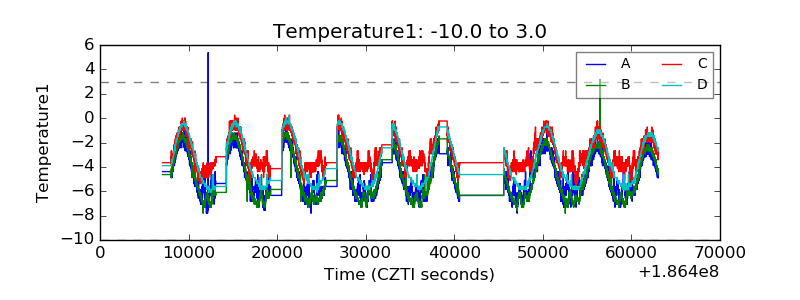 |
| Veto HV Monitor |  |
| Veto LLD | 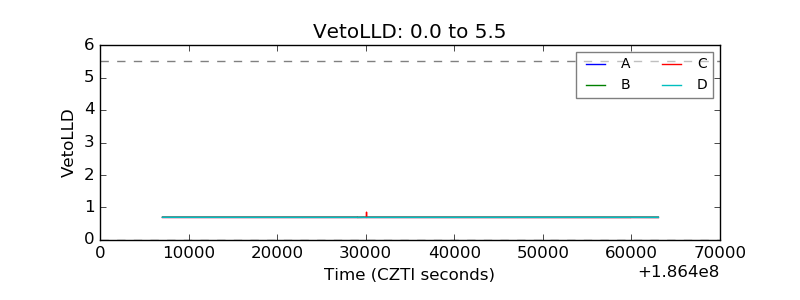 |
| Alpha Counter | 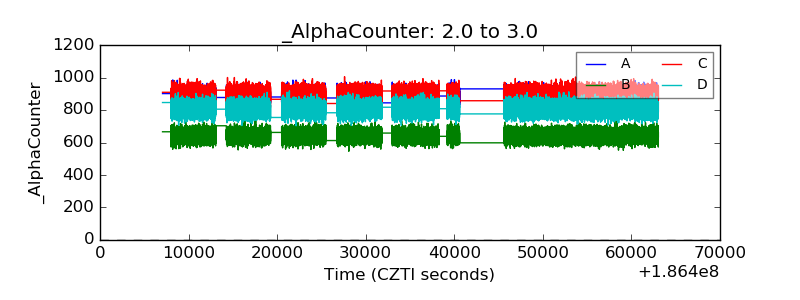 |
| _CPM_Rate |  |
| CZT Counter |  |
| +2.5 Volts monitor |  |
| +5 Volts monitor |  |
| _ROLL_ROT | 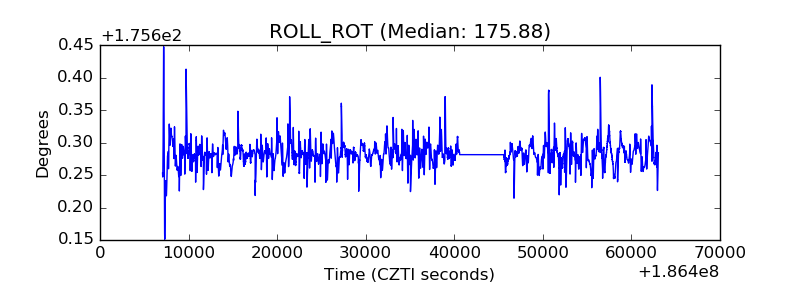 |
| _Roll_DEC | 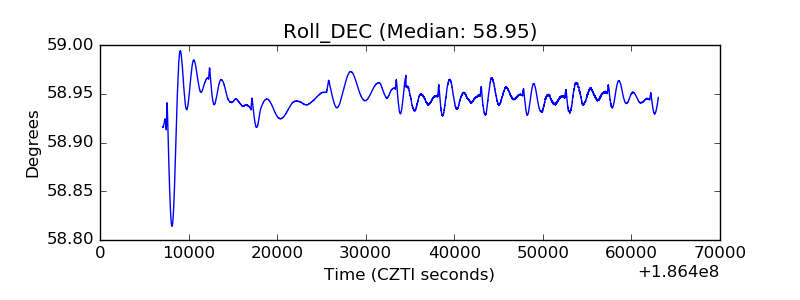 |
| _Roll_RA |  |
| Veto Counter |  |