| Param | Original file | Final file |
|---|---|---|
| Filename | modeM0/AS1P01_161T05_9000000180cztM0_level2.evt | modeM0/AS1P01_161T05_9000000180cztM0_level2_quad_clean.evt |
| Size (bytes) | 7,701,762,240 | 491,647,680 |
| Size | 7.2 GB | 468.9 MB |
| Events in quadrant A | 51,462,997 | 3,117,161 |
| Events in quadrant B | 69,883,027 | 2,850,809 |
| Events in quadrant C | 56,487,224 | 3,087,478 |
| Events in quadrant D | 52,610,391 | 2,899,197 |
| Mode M9 | |||
|---|---|---|---|
| Quadrant | BADHDUFLAG | Total packets | Discarded packets |
| A | 0 | 45 | 0 |
| B | 0 | 45 | 0 |
| C | 0 | 45 | 0 |
| D | 0 | 45 | 0 |
| Mode M0 | |||
|---|---|---|---|
| Quadrant | BADHDUFLAG | Total packets | Discarded packets |
| A | 0 | 183206 | 0 |
| B | 0 | 238723 | 0 |
| C | 0 | 198103 | 0 |
| D | 0 | 186974 | 0 |
| Mode SS | |||
|---|---|---|---|
| Quadrant | BADHDUFLAG | Total packets | Discarded packets |
| A | 0 | 870 | 0 |
| B | 0 | 870 | 0 |
| C | 0 | 870 | 0 |
| D | 0 | 870 | 0 |
| Quadrant | Total seconds | Saturated seconds | Saturation percentage |
|---|---|---|---|
| A | 42736 | 190 | 0.444590% |
| B | 42736 | 5448 | 12.748034% |
| C | 42736 | 266 | 0.622426% |
| D | 42736 | 1699 | 3.975571% |
Noise dominated data is calculated using 1-second bins in cleaned event files. If a bin has >2000 counts, and if more than 50% of those come from <1% of pixels, then it is considered to be noise-dominated and hence unusable.
| Quadrant | # 1 sec bins | Bins with >0 counts | Bins with >2000 counts | High rate bins dominated by noise | Noise dominated (total time) | Noise dominated (detector-on time) | Marked lightcurve |
|---|---|---|---|---|---|---|---|
| A | 47326 | 42745 | 1733 | 1733 | 3.66% | 4.05% | 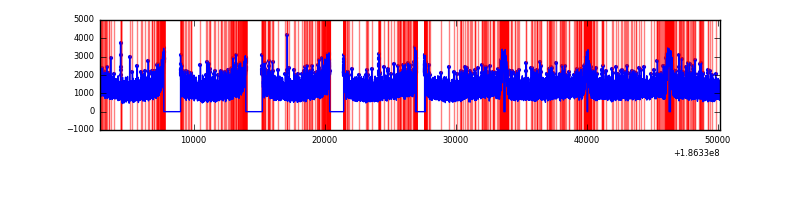 |
| B | 47326 | 42744 | 9757 | 9757 | 20.62% | 22.83% | 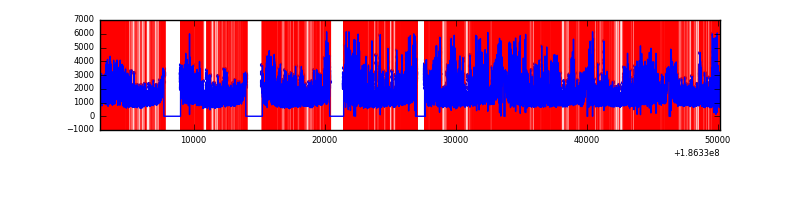 |
| C | 47326 | 42745 | 2652 | 2652 | 5.60% | 6.20% |  |
| D | 47326 | 42745 | 3531 | 3531 | 7.46% | 8.26% | 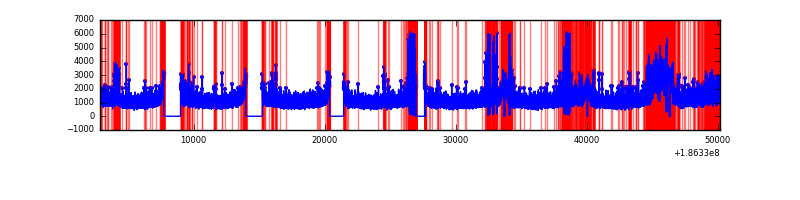 |
Top three noisy pixels from each quadrant. If the there are fewer than three noisy pixels in the level2.evt file, extra rows are filled as -1
| Pixel properties | Quadrant properties | ||||||
|---|---|---|---|---|---|---|---|
| Quadrant | DetID | PixID | Counts | Sigma | Mean | Median | Sigma |
| A | 15 | 127 | 517467 | 158.48 | 13206 | 13306 | 3181.1 |
| A | 14 | 170 | 160134 | 46.16 | 13206 | 13306 | 3181.1 |
| A | 15 | 233 | 119248 | 33.3 | 13206 | 13306 | 3181.1 |
| B | 3 | 0 | 18222490 | 6040.65 | 12941 | 13031 | 3014.5 |
| B | 0 | 87 | 569612 | 184.64 | 12941 | 13031 | 3014.5 |
| B | 0 | 220 | 513965 | 166.18 | 12941 | 13031 | 3014.5 |
| C | 9 | 83 | 6719337 | 1914.9 | 12577 | 13029 | 3502.2 |
| C | 9 | 54 | 217575 | 58.41 | 12577 | 13029 | 3502.2 |
| C | 3 | 111 | 174545 | 46.12 | 12577 | 13029 | 3502.2 |
| D | 13 | 73 | 2440361 | 690.82 | 12311 | 12527 | 3514.4 |
| D | 12 | 188 | 2176023 | 615.6 | 12311 | 12527 | 3514.4 |
| D | 1 | 4 | 471124 | 130.49 | 12311 | 12527 | 3514.4 |
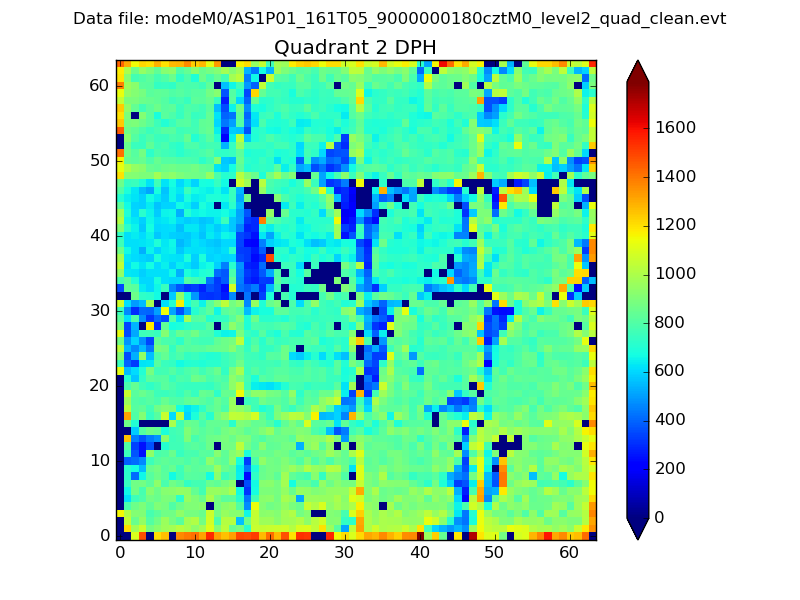
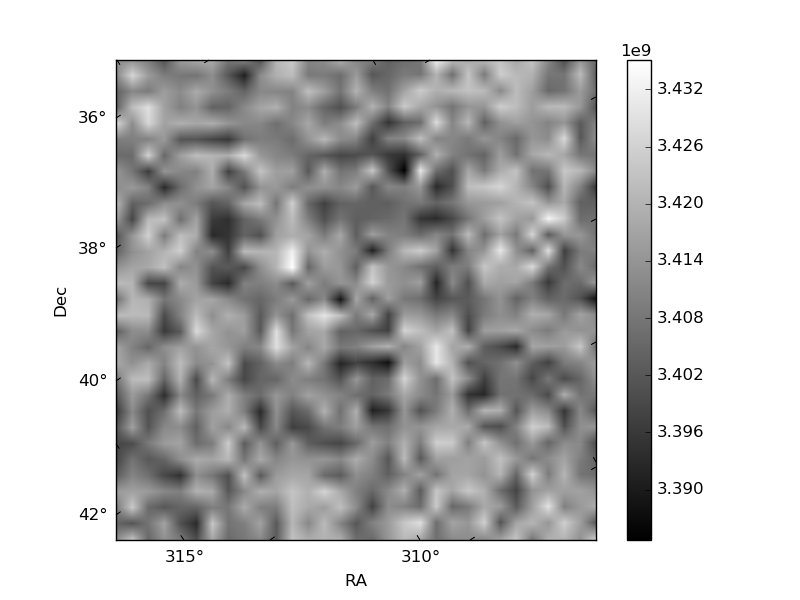
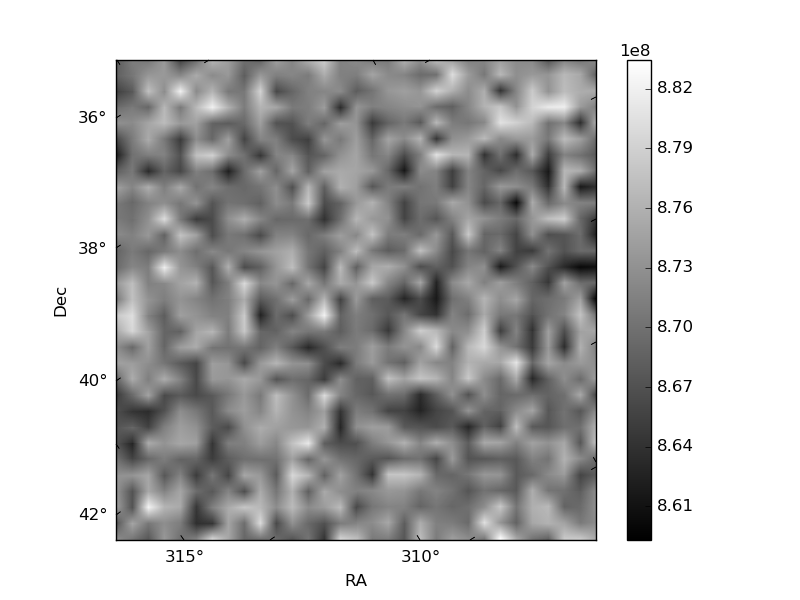
Histogram calculated using DETX and DETY for each event in the final _common_clean file
| Quadrant A |  |
 |
Quadrant B |
|---|---|---|---|
| Quadrant D |  |
 |
Quadrant C |
| Plot type | Count rate plots | Images |
|---|---|---|
| Comparison with Poisson distribution Blue bars denote a histogram of data divided into 1 sec bins. Red curve is a Poisson curve with rate = median count rate of data. |
 |
 |
| Quadrant-wise count rates Data is divided into 100 sec bins |
 |
|
| Module-wise count rates for Quadrant A Data is divided into 100 sec bins |
 |
 |
| Module-wise count rates for Quadrant B Data is divided into 100 sec bins |
 |
 |
| Module-wise count rates for Quadrant C Data is divided into 100 sec bins |
 |
 |
| Module-wise count rates for Quadrant D Data is divided into 100 sec bins |
 |
 |
| Parameter | Plot |
|---|---|
| CZT HV Monitor | 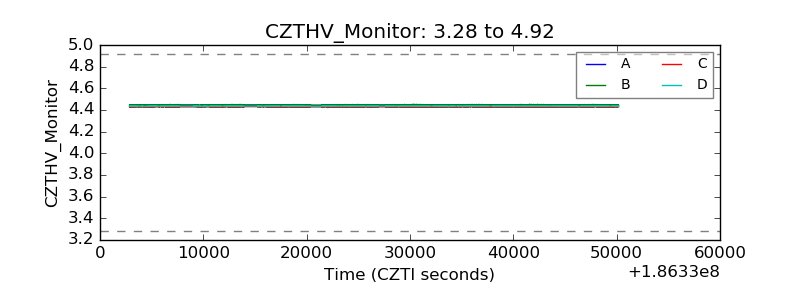 |
| D_VDD | 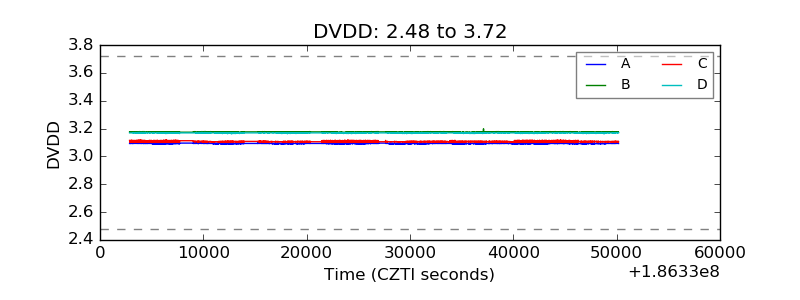 |
| Temperature 1 |  |
| Veto HV Monitor | 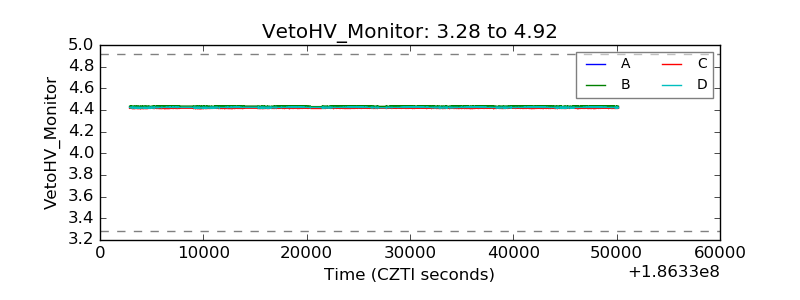 |
| Veto LLD |  |
| Alpha Counter | 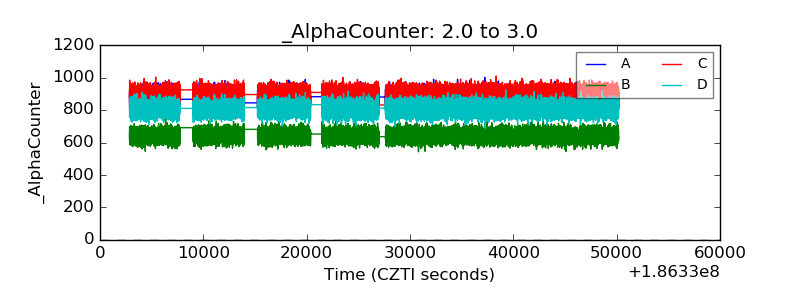 |
| _CPM_Rate |  |
| CZT Counter |  |
| +2.5 Volts monitor |  |
| +5 Volts monitor | 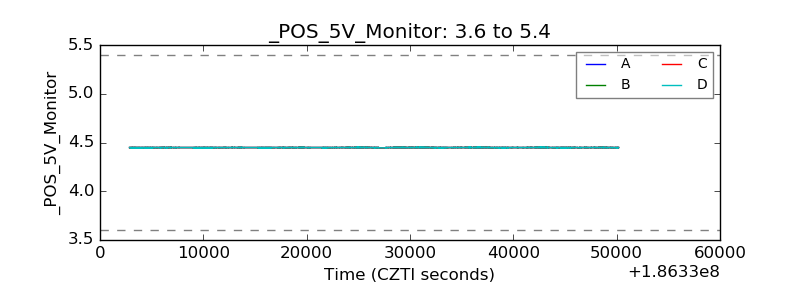 |
| _ROLL_ROT | 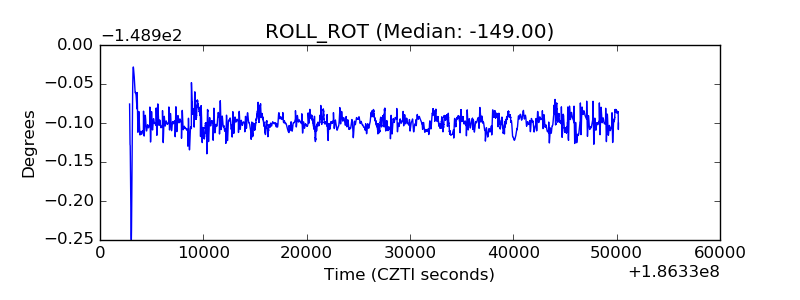 |
| _Roll_DEC |  |
| _Roll_RA |  |
| Veto Counter |  |