| Param | Original file | Final file |
|---|---|---|
| Filename | modeM0/AS1P01_161T03_9000000178cztM0_level2.evt | modeM0/AS1P01_161T03_9000000178cztM0_level2_quad_clean.evt |
| Size (bytes) | 8,113,610,880 | 581,083,200 |
| Size | 7.6 GB | 554.2 MB |
| Events in quadrant A | 55,563,186 | 3,745,829 |
| Events in quadrant B | 74,025,179 | 3,545,339 |
| Events in quadrant C | 60,703,750 | 3,589,317 |
| Events in quadrant D | 52,387,114 | 3,539,531 |
| Mode SS | |||
|---|---|---|---|
| Quadrant | BADHDUFLAG | Total packets | Discarded packets |
| A | 0 | 942 | 0 |
| B | 0 | 942 | 0 |
| C | 0 | 942 | 0 |
| D | 0 | 942 | 0 |
| Mode M0 | |||
|---|---|---|---|
| Quadrant | BADHDUFLAG | Total packets | Discarded packets |
| A | 0 | 197898 | 0 |
| B | 0 | 253151 | 0 |
| C | 0 | 213493 | 0 |
| D | 0 | 188635 | 0 |
| Mode M9 | |||
|---|---|---|---|
| Quadrant | BADHDUFLAG | Total packets | Discarded packets |
| A | 0 | 58 | 0 |
| B | 0 | 58 | 0 |
| C | 0 | 58 | 0 |
| D | 0 | 58 | 0 |
| Quadrant | Total seconds | Saturated seconds | Saturation percentage |
|---|---|---|---|
| A | 46312 | 266 | 0.574365% |
| B | 46311 | 4310 | 9.306644% |
| C | 46312 | 1683 | 3.634047% |
| D | 46312 | 498 | 1.075315% |
Noise dominated data is calculated using 1-second bins in cleaned event files. If a bin has >2000 counts, and if more than 50% of those come from <1% of pixels, then it is considered to be noise-dominated and hence unusable.
| Quadrant | # 1 sec bins | Bins with >0 counts | Bins with >2000 counts | High rate bins dominated by noise | Noise dominated (total time) | Noise dominated (detector-on time) | Marked lightcurve |
|---|---|---|---|---|---|---|---|
| A | 51172 | 46320 | 1788 | 1788 | 3.49% | 3.86% |  |
| B | 51172 | 46320 | 9540 | 9540 | 18.64% | 20.60% |  |
| C | 51172 | 46320 | 3785 | 3785 | 7.40% | 8.17% | 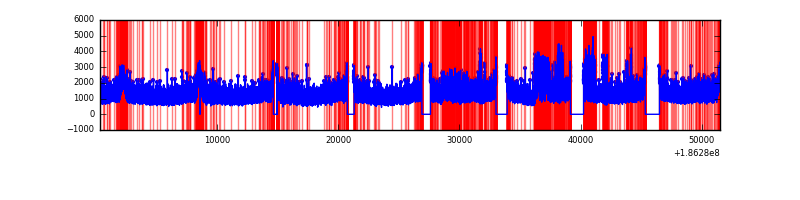 |
| D | 51172 | 46320 | 1587 | 1587 | 3.10% | 3.43% | 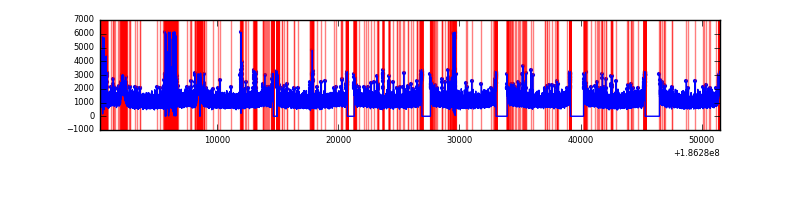 |
Top three noisy pixels from each quadrant. If the there are fewer than three noisy pixels in the level2.evt file, extra rows are filled as -1
| Pixel properties | Quadrant properties | ||||||
|---|---|---|---|---|---|---|---|
| Quadrant | DetID | PixID | Counts | Sigma | Mean | Median | Sigma |
| A | 14 | 170 | 164532 | 43.31 | 14417 | 14534 | 3463.0 |
| A | 15 | 233 | 67086 | 15.18 | 14417 | 14534 | 3463.0 |
| A | 15 | 127 | 58967 | 12.83 | 14417 | 14534 | 3463.0 |
| B | 3 | 0 | 16303156 | 4814.58 | 14448 | 14532 | 3383.2 |
| B | 8 | 38 | 1537834 | 450.26 | 14448 | 14532 | 3383.2 |
| B | 5 | 249 | 298568 | 83.96 | 14448 | 14532 | 3383.2 |
| C | 9 | 83 | 7183241 | 1898.36 | 13528 | 14024 | 3776.5 |
| C | 15 | 241 | 194662 | 47.83 | 13528 | 14024 | 3776.5 |
| C | 3 | 111 | 188343 | 46.16 | 13528 | 14024 | 3776.5 |
| D | 1 | 4 | 877233 | 219.0 | 13612 | 13910 | 3942.1 |
| D | 10 | 125 | 175548 | 41.0 | 13612 | 13910 | 3942.1 |
| D | 13 | 169 | 126703 | 28.61 | 13612 | 13910 | 3942.1 |
Histogram calculated using DETX and DETY for each event in the final _common_clean file
| Quadrant A | 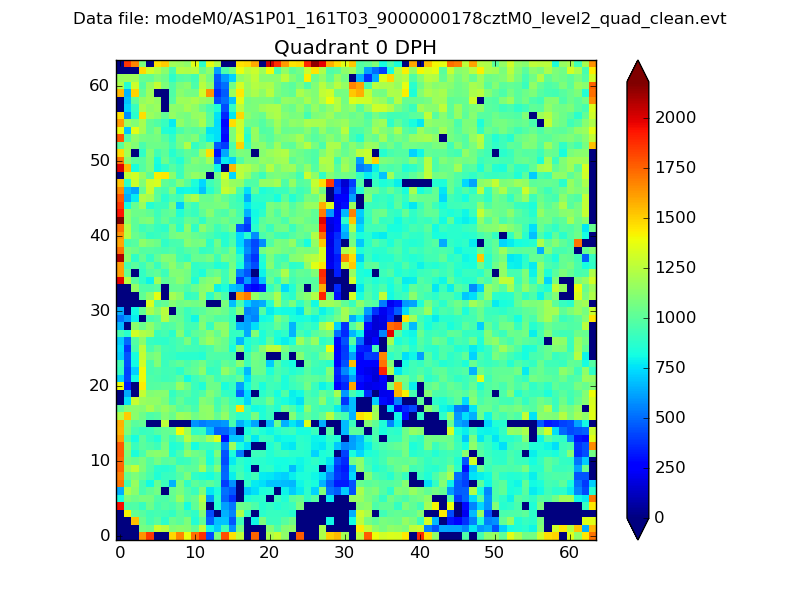 |
 |
Quadrant B |
|---|---|---|---|
| Quadrant D |  |
 |
Quadrant C |
| Plot type | Count rate plots | Images |
|---|---|---|
| Comparison with Poisson distribution Blue bars denote a histogram of data divided into 1 sec bins. Red curve is a Poisson curve with rate = median count rate of data. |
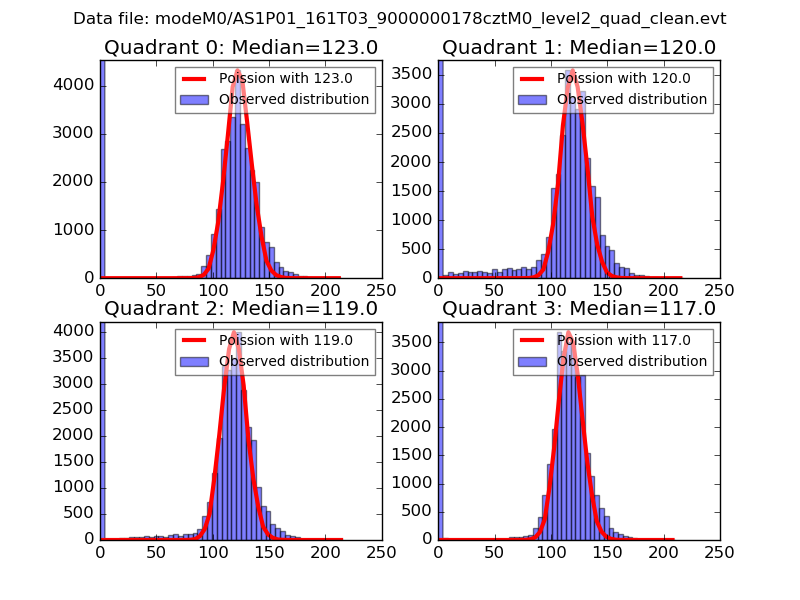 |
 |
| Quadrant-wise count rates Data is divided into 100 sec bins |
 |
|
| Module-wise count rates for Quadrant A Data is divided into 100 sec bins |
 |
 |
| Module-wise count rates for Quadrant B Data is divided into 100 sec bins |
 |
 |
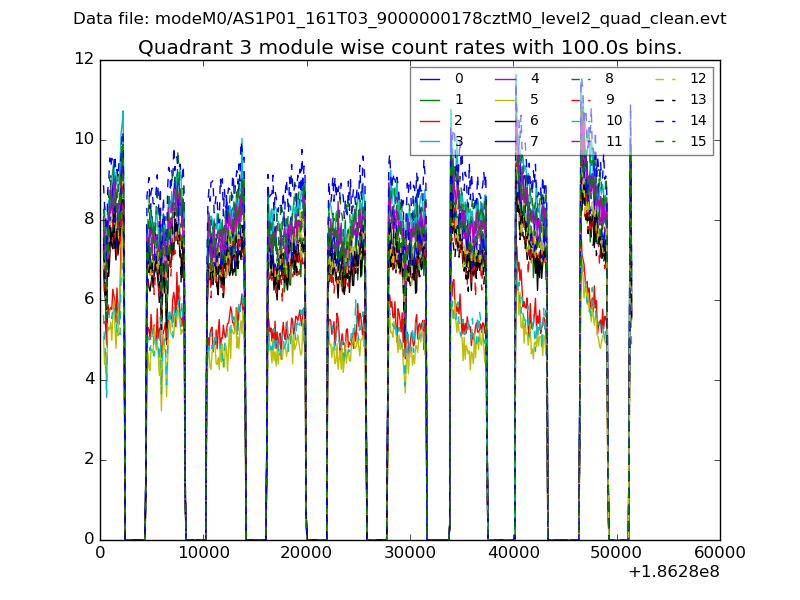
| Module-wise count rates for Quadrant C Data is divided into 100 sec bins |
 |
 |
| Module-wise count rates for Quadrant D Data is divided into 100 sec bins |
 |
 |
| Parameter | Plot |
|---|---|
| CZT HV Monitor | 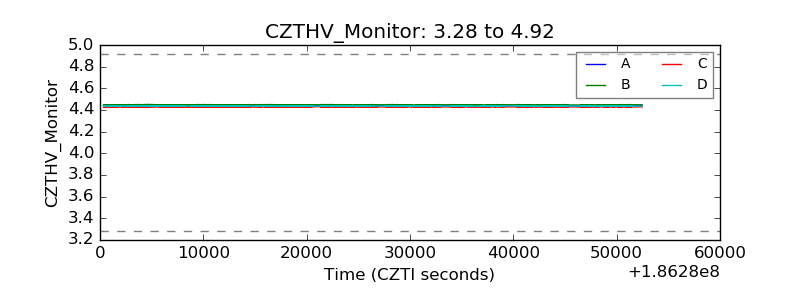 |
| D_VDD |  |
| Temperature 1 |  |
| Veto HV Monitor |  |
| Veto LLD |  |
| Alpha Counter |  |
| _CPM_Rate |  |
| CZT Counter |  |
| +2.5 Volts monitor | 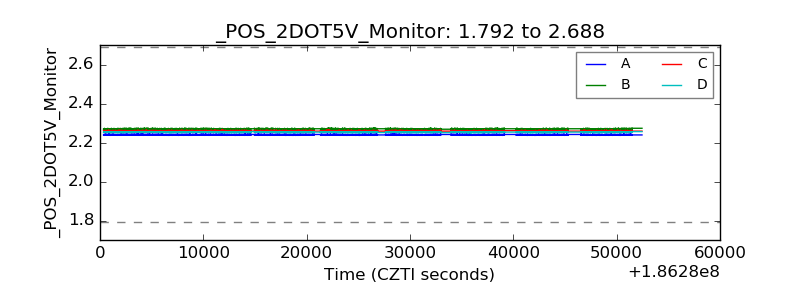 |
| +5 Volts monitor |  |
| _ROLL_ROT |  |
| _Roll_DEC |  |
| _Roll_RA | 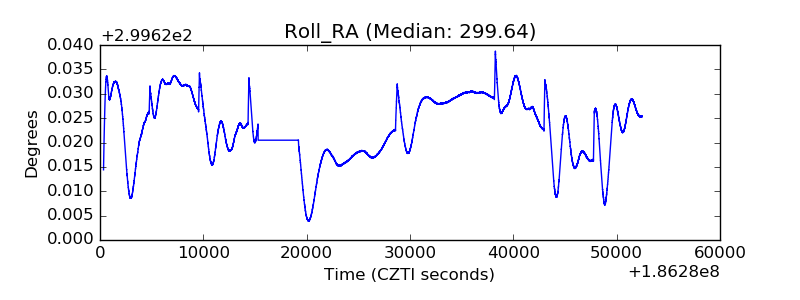 |
| Veto Counter |  |