| Param | Original file | Final file |
|---|---|---|
| Filename | modeM0/AS1P01_999T99_9000000168cztM0_level2_bc.evt | modeM0/AS1P01_999T99_9000000168cztM0_level2_quad_clean.evt |
| Size (bytes) | 46,206,720 | 27,858,240 |
| Size | 44.1 MB | 26.6 MB |
| Events in quadrant A | 300,246 | 176,532 |
| Events in quadrant B | 322,900 | 178,851 |
| Events in quadrant C | 328,148 | 178,808 |
| Events in quadrant D | 313,731 | 174,292 |
| Mode M0 | |||
|---|---|---|---|
| Quadrant | BADHDUFLAG | Total packets | Discarded packets |
| A | 0 | 7436 | 0 |
| B | 0 | 7546 | 0 |
| C | 0 | 6814 | 1 |
| D | 0 | 6469 | 0 |
| Mode SS | |||
|---|---|---|---|
| Quadrant | BADHDUFLAG | Total packets | Discarded packets |
| A | 0 | 36 | 0 |
| B | 0 | 36 | 0 |
| C | 0 | 36 | 0 |
| D | 0 | 36 | 0 |
| Quadrant | Total seconds | Saturated seconds | Saturation percentage |
|---|---|---|---|
| A | 1848 | 0 | 0.000000% |
| B | 1848 | 0 | 0.000000% |
| C | 1848 | 0 | 0.000000% |
| D | 1848 | 0 | 0.000000% |
Noise dominated data is calculated using 1-second bins in cleaned event files. If a bin has >2000 counts, and if more than 50% of those come from <1% of pixels, then it is considered to be noise-dominated and hence unusable.
| Quadrant | # 1 sec bins | Bins with >0 counts | Bins with >2000 counts | High rate bins dominated by noise | Noise dominated (total time) | Noise dominated (detector-on time) | Marked lightcurve |
|---|---|---|---|---|---|---|---|
| A | 1848 | 1848 | 0 | 0 | 0.00% | 0.00% |  |
| B | 1848 | 1848 | 0 | 0 | 0.00% | 0.00% |  |
| C | 1848 | 1848 | 0 | 0 | 0.00% | 0.00% |  |
| D | 1848 | 1848 | 0 | 0 | 0.00% | 0.00% |  |
Top three noisy pixels from each quadrant. If the there are fewer than three noisy pixels in the level2.evt file, extra rows are filled as -1
| Pixel properties | Quadrant properties | ||||||
|---|---|---|---|---|---|---|---|
| Quadrant | DetID | PixID | Counts | Sigma | Mean | Median | Sigma |
| A | 15 | 127 | 380 | 16.46 | 78 | 76 | 18.5 |
| A | 8 | 35 | 197 | 6.55 | 78 | 76 | 18.5 |
| A | 12 | 244 | 182 | 5.74 | 78 | 76 | 18.5 |
| B | 8 | 38 | 8759 | 520.98 | 79 | 77 | 16.7 |
| B | 0 | 184 | 3046 | 178.16 | 79 | 77 | 16.7 |
| B | 15 | 255 | 2001 | 115.45 | 79 | 77 | 16.7 |
| C | 3 | 143 | 6706 | 357.94 | 77 | 76 | 18.5 |
| C | 15 | 241 | 5264 | 280.09 | 77 | 76 | 18.5 |
| C | 3 | 111 | 3381 | 178.43 | 77 | 76 | 18.5 |
| D | 1 | 4 | 16884 | 912.91 | 76 | 74 | 18.4 |
| D | 13 | 170 | 3223 | 171.01 | 76 | 74 | 18.4 |
| D | 10 | 125 | 1378 | 70.82 | 76 | 74 | 18.4 |
Histogram calculated using DETX and DETY for each event in the final _common_clean file
| Quadrant A | 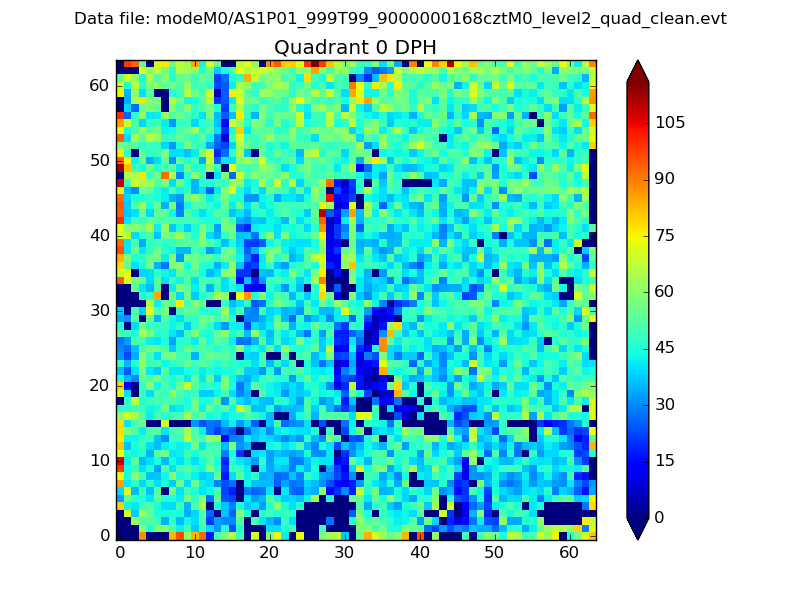 |
 |
Quadrant B |
|---|---|---|---|
| Quadrant D |  |
 |
Quadrant C |
| Plot type | Count rate plots | Images |
|---|---|---|
| Comparison with Poisson distribution Blue bars denote a histogram of data divided into 1 sec bins. Red curve is a Poisson curve with rate = median count rate of data. |
 |
 |
| Quadrant-wise count rates Data is divided into 100 sec bins |
 |
|
| Module-wise count rates for Quadrant A Data is divided into 100 sec bins |
 |
 |
| Module-wise count rates for Quadrant B Data is divided into 100 sec bins |
 |
 |
| Module-wise count rates for Quadrant C Data is divided into 100 sec bins |
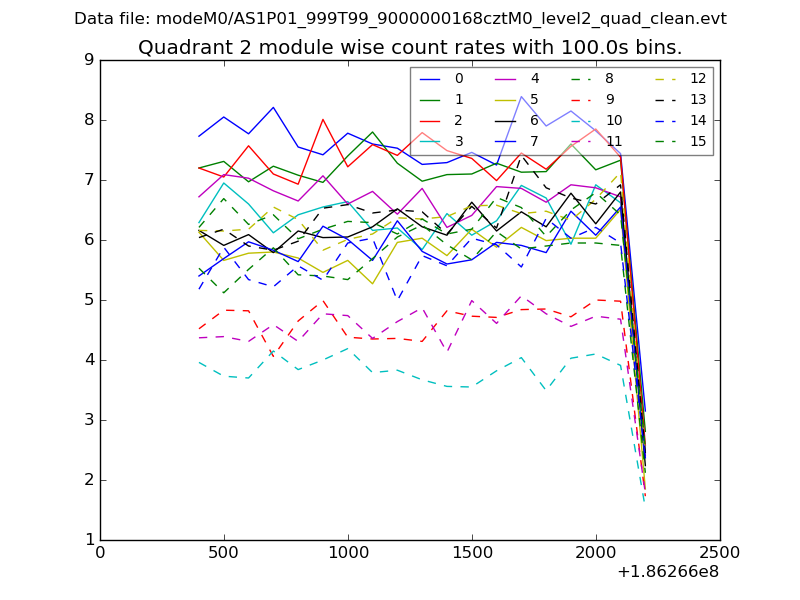 |
 |
| Module-wise count rates for Quadrant D Data is divided into 100 sec bins |
 |
 |
| Parameter | Plot |
|---|---|
| CZT HV Monitor |  |
| D_VDD |  |
| Temperature 1 |  |
| Veto HV Monitor |  |
| Veto LLD |  |
| Alpha Counter |  |
| _CPM_Rate |  |
| CZT Counter |  |
| +2.5 Volts monitor |  |
| +5 Volts monitor |  |
| _ROLL_ROT |  |
| _Roll_DEC |  |
| _Roll_RA |  |
| Veto Counter |  |