| Param | Original file | Final file |
|---|---|---|
| Filename | modeM0/AS1P01_999T99_9000000160cztM0_level2_bc.evt | modeM0/AS1P01_999T99_9000000160cztM0_level2_quad_clean.evt |
| Size (bytes) | 40,544,640 | 23,708,160 |
| Size | 38.7 MB | 22.6 MB |
| Events in quadrant A | 266,360 | 151,914 |
| Events in quadrant B | 291,941 | 153,266 |
| Events in quadrant C | 283,836 | 154,686 |
| Events in quadrant D | 278,565 | 150,183 |
| Mode SS | |||
|---|---|---|---|
| Quadrant | BADHDUFLAG | Total packets | Discarded packets |
| A | 0 | 30 | 0 |
| B | 0 | 30 | 0 |
| C | 0 | 30 | 0 |
| D | 0 | 30 | 0 |
| Mode M9 | |||
|---|---|---|---|
| Quadrant | BADHDUFLAG | Total packets | Discarded packets |
| A | 0 | 4 | 0 |
| B | 0 | 4 | 0 |
| C | 0 | 4 | 0 |
| D | 0 | 4 | 0 |
| Mode M0 | |||
|---|---|---|---|
| Quadrant | BADHDUFLAG | Total packets | Discarded packets |
| A | 0 | 6680 | 0 |
| B | 0 | 6905 | 0 |
| C | 0 | 6205 | 0 |
| D | 0 | 5888 | 0 |
| Quadrant | Total seconds | Saturated seconds | Saturation percentage |
|---|---|---|---|
| A | 1450 | 17 | 1.172414% |
| B | 1450 | 7 | 0.482759% |
| C | 1450 | 12 | 0.827586% |
| D | 1450 | 7 | 0.482759% |
Noise dominated data is calculated using 1-second bins in cleaned event files. If a bin has >2000 counts, and if more than 50% of those come from <1% of pixels, then it is considered to be noise-dominated and hence unusable.
| Quadrant | # 1 sec bins | Bins with >0 counts | Bins with >2000 counts | High rate bins dominated by noise | Noise dominated (total time) | Noise dominated (detector-on time) | Marked lightcurve |
|---|---|---|---|---|---|---|---|
| A | 1450 | 1450 | 0 | 0 | 0.00% | 0.00% | 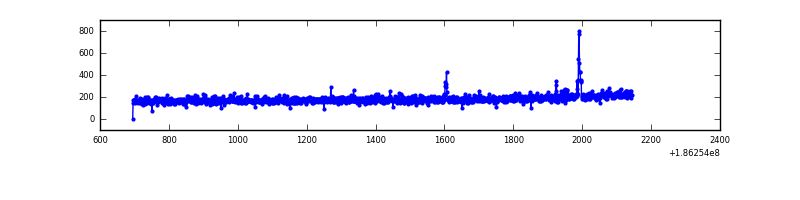 |
| B | 1450 | 1450 | 0 | 0 | 0.00% | 0.00% | 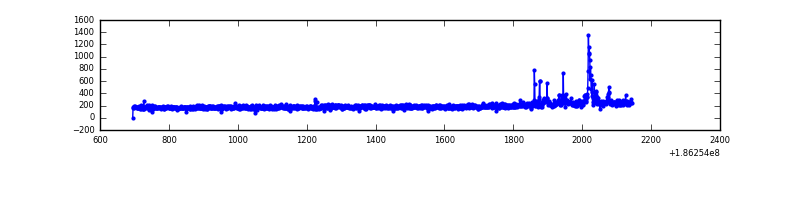 |
| C | 1450 | 1450 | 0 | 0 | 0.00% | 0.00% |  |
| D | 1450 | 1450 | 0 | 0 | 0.00% | 0.00% |  |
Top three noisy pixels from each quadrant. If the there are fewer than three noisy pixels in the level2.evt file, extra rows are filled as -1
| Pixel properties | Quadrant properties | ||||||
|---|---|---|---|---|---|---|---|
| Quadrant | DetID | PixID | Counts | Sigma | Mean | Median | Sigma |
| A | 14 | 79 | 5093 | 312.79 | 67 | 66 | 16.1 |
| A | 14 | 170 | 815 | 46.6 | 67 | 66 | 16.1 |
| A | 10 | 83 | 179 | 7.03 | 67 | 66 | 16.1 |
| B | 8 | 38 | 16600 | 1138.18 | 69 | 67 | 14.5 |
| B | 15 | 22 | 5777 | 393.09 | 69 | 67 | 14.5 |
| B | 0 | 220 | 3781 | 255.68 | 69 | 67 | 14.5 |
| C | 15 | 241 | 3842 | 230.12 | 67 | 66 | 16.4 |
| C | 9 | 83 | 3020 | 180.03 | 67 | 66 | 16.4 |
| C | 3 | 111 | 2834 | 168.69 | 67 | 66 | 16.4 |
| D | 1 | 4 | 13863 | 844.27 | 66 | 64 | 16.3 |
| D | 13 | 170 | 12810 | 779.84 | 66 | 64 | 16.3 |
| D | 10 | 125 | 468 | 24.72 | 66 | 64 | 16.3 |
Histogram calculated using DETX and DETY for each event in the final _common_clean file
| Quadrant A | 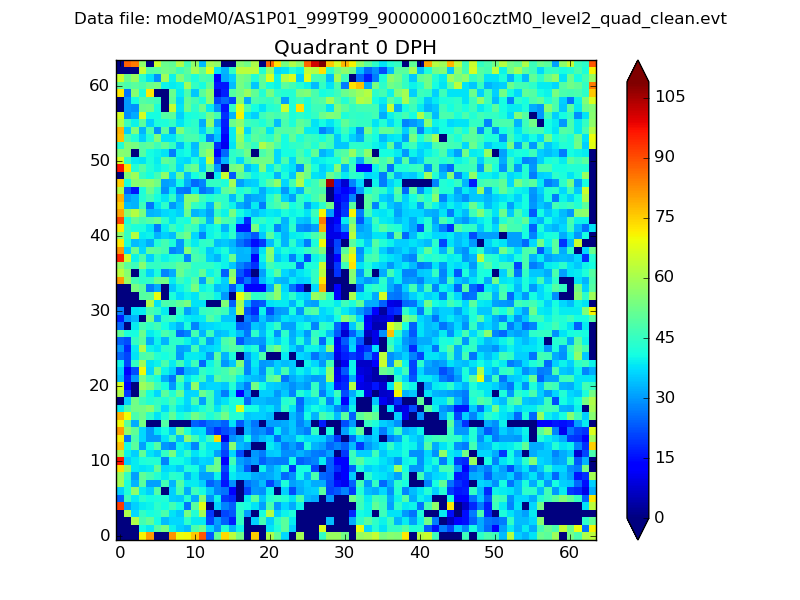 |
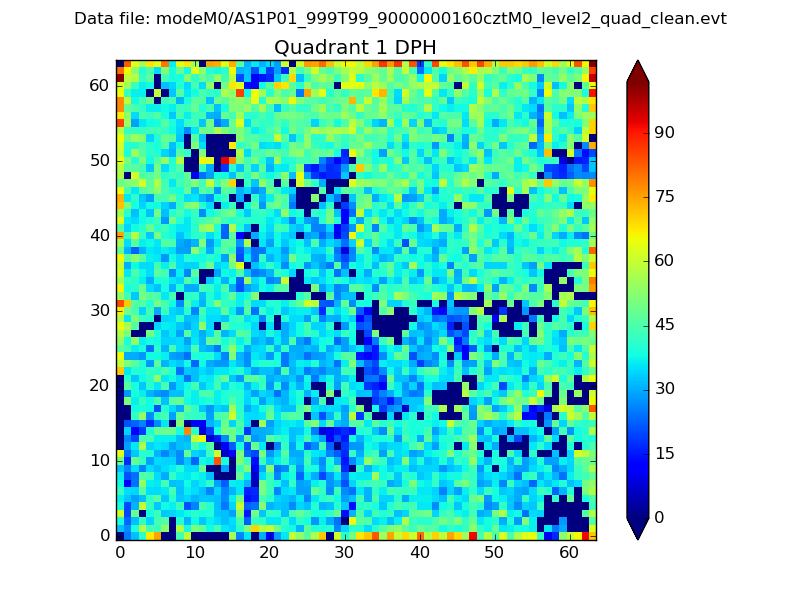 |
Quadrant B |
|---|---|---|---|
| Quadrant D |  |
 |
Quadrant C |
| Plot type | Count rate plots | Images |
|---|---|---|
| Comparison with Poisson distribution Blue bars denote a histogram of data divided into 1 sec bins. Red curve is a Poisson curve with rate = median count rate of data. |
 |
 |
| Quadrant-wise count rates Data is divided into 100 sec bins |
 |
|
| Module-wise count rates for Quadrant A Data is divided into 100 sec bins |
 |
 |
| Module-wise count rates for Quadrant B Data is divided into 100 sec bins |
 |
 |
| Module-wise count rates for Quadrant C Data is divided into 100 sec bins |
 |
 |
| Module-wise count rates for Quadrant D Data is divided into 100 sec bins |
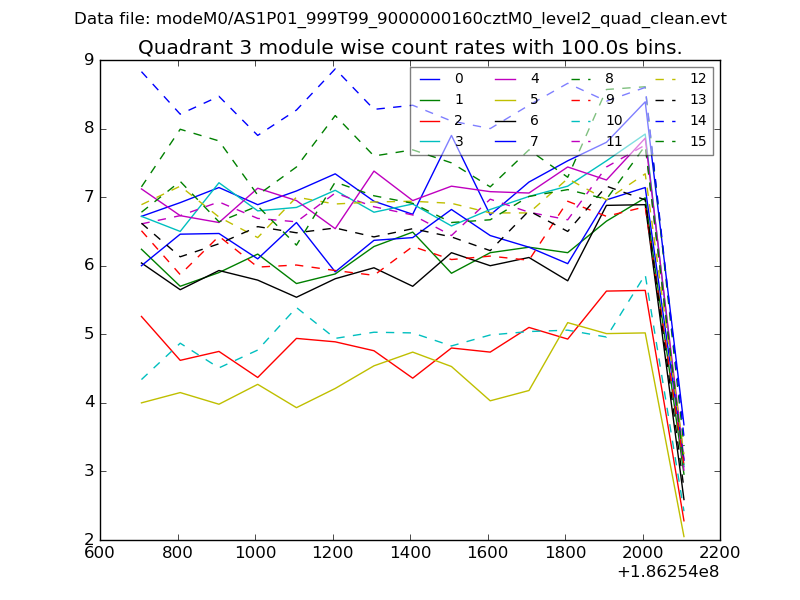 |
 |
| Parameter | Plot |
|---|---|
| CZT HV Monitor | 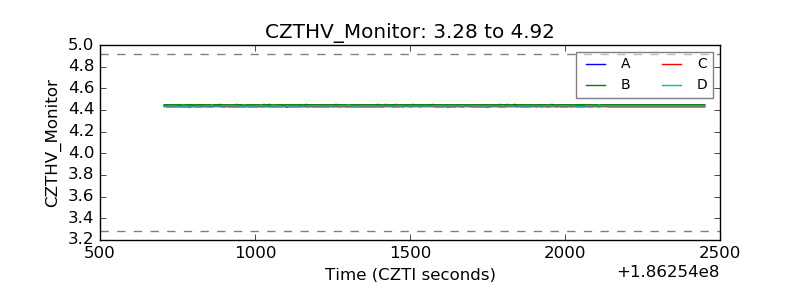 |
| D_VDD |  |
| Temperature 1 |  |
| Veto HV Monitor | 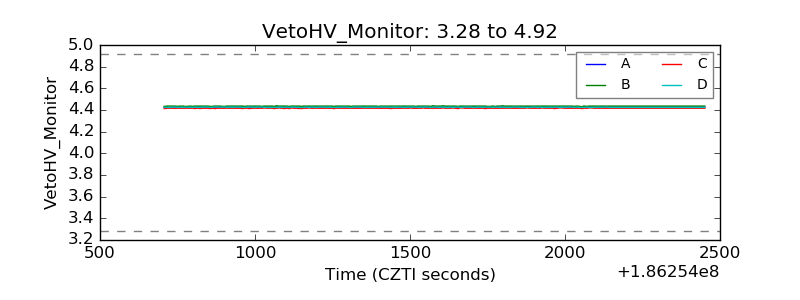 |
| Veto LLD |  |
| Alpha Counter | 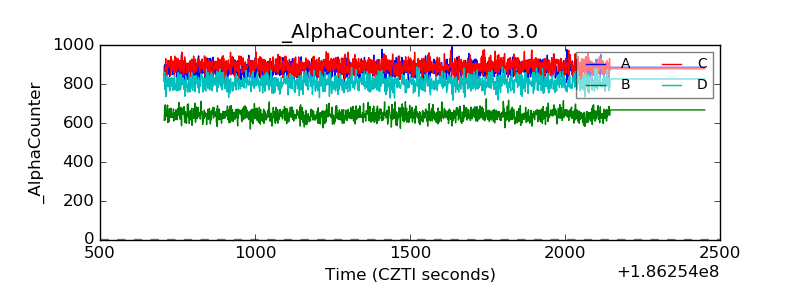 |
| _CPM_Rate |  |
| CZT Counter | 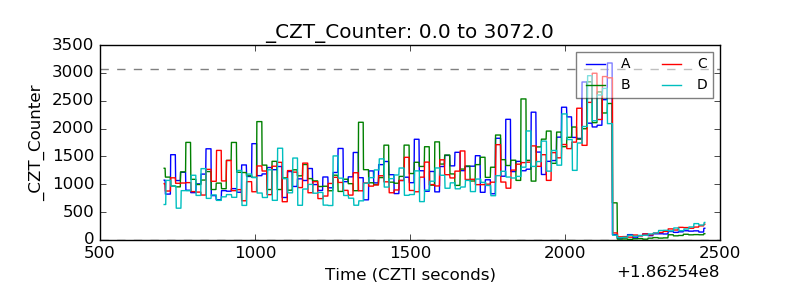 |
| +2.5 Volts monitor |  |
| +5 Volts monitor |  |
| _ROLL_ROT |  |
| _Roll_DEC |  |
| _Roll_RA |  |
| Veto Counter |  |