| Param | Original file | Final file |
|---|---|---|
| Filename | modeM0/AS1P01_999T99_9000000156cztM0_level2_bc.evt | modeM0/AS1P01_999T99_9000000156cztM0_level2_quad_clean.evt |
| Size (bytes) | 29,911,680 | 17,686,080 |
| Size | 28.5 MB | 16.9 MB |
| Events in quadrant A | 195,832 | 113,114 |
| Events in quadrant B | 216,993 | 113,119 |
| Events in quadrant C | 207,440 | 114,439 |
| Events in quadrant D | 204,017 | 112,444 |
| Mode SS | |||
|---|---|---|---|
| Quadrant | BADHDUFLAG | Total packets | Discarded packets |
| A | 0 | 48 | 24 |
| B | 0 | 48 | 24 |
| C | 0 | 48 | 24 |
| D | 0 | 48 | 24 |
| Mode M9 | |||
|---|---|---|---|
| Quadrant | BADHDUFLAG | Total packets | Discarded packets |
| A | 0 | 16 | 8 |
| B | 0 | 16 | 8 |
| C | 0 | 16 | 8 |
| D | 0 | 16 | 8 |
| Mode M0 | |||
|---|---|---|---|
| Quadrant | BADHDUFLAG | Total packets | Discarded packets |
| A | 0 | 10210 | 5105 |
| B | 0 | 10542 | 5271 |
| C | 0 | 9426 | 4713 |
| D | 0 | 8954 | 4477 |
| Quadrant | Total seconds | Saturated seconds | Saturation percentage |
|---|---|---|---|
| A | 1070 | 22 | 2.056075% |
| B | 1070 | 20 | 1.869159% |
| C | 1070 | 18 | 1.682243% |
| D | 1070 | 19 | 1.775701% |
Noise dominated data is calculated using 1-second bins in cleaned event files. If a bin has >2000 counts, and if more than 50% of those come from <1% of pixels, then it is considered to be noise-dominated and hence unusable.
| Quadrant | # 1 sec bins | Bins with >0 counts | Bins with >2000 counts | High rate bins dominated by noise | Noise dominated (total time) | Noise dominated (detector-on time) | Marked lightcurve |
|---|---|---|---|---|---|---|---|
| A | 1069 | 1069 | 0 | 0 | 0.00% | 0.00% |  |
| B | 1069 | 1069 | 0 | 0 | 0.00% | 0.00% | 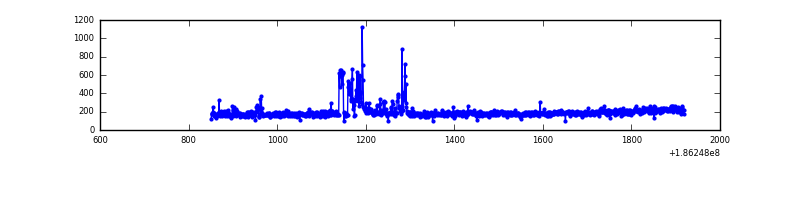 |
| C | 1069 | 1069 | 0 | 0 | 0.00% | 0.00% |  |
| D | 1069 | 1069 | 0 | 0 | 0.00% | 0.00% |  |
Top three noisy pixels from each quadrant. If the there are fewer than three noisy pixels in the level2.evt file, extra rows are filled as -1
| Pixel properties | Quadrant properties | ||||||
|---|---|---|---|---|---|---|---|
| Quadrant | DetID | PixID | Counts | Sigma | Mean | Median | Sigma |
| A | 14 | 170 | 1875 | 143.62 | 50 | 49 | 12.7 |
| A | 14 | 79 | 390 | 26.82 | 50 | 49 | 12.7 |
| A | 0 | 214 | 164 | 9.05 | 50 | 49 | 12.7 |
| B | 3 | 0 | 20197 | 1765.4 | 50 | 49 | 11.4 |
| B | 4 | 200 | 1402 | 118.55 | 50 | 49 | 11.4 |
| B | 5 | 191 | 901 | 74.65 | 50 | 49 | 11.4 |
| C | 15 | 241 | 2484 | 191.64 | 49 | 49 | 12.7 |
| C | 3 | 111 | 2218 | 170.7 | 49 | 49 | 12.7 |
| C | 3 | 79 | 2178 | 167.55 | 49 | 49 | 12.7 |
| D | 11 | 131 | 10079 | 801.68 | 49 | 47 | 12.5 |
| D | 13 | 72 | 2376 | 186.11 | 49 | 47 | 12.5 |
| D | 9 | 52 | 1600 | 124.1 | 49 | 47 | 12.5 |
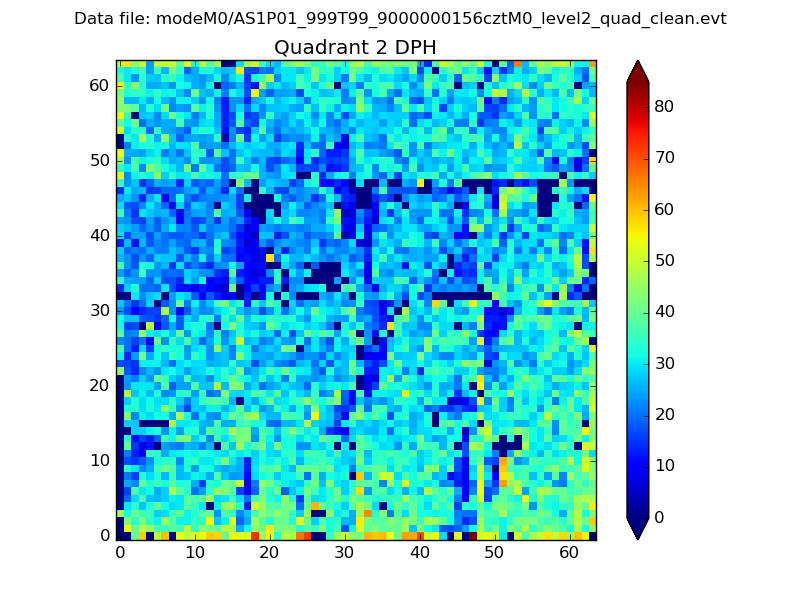
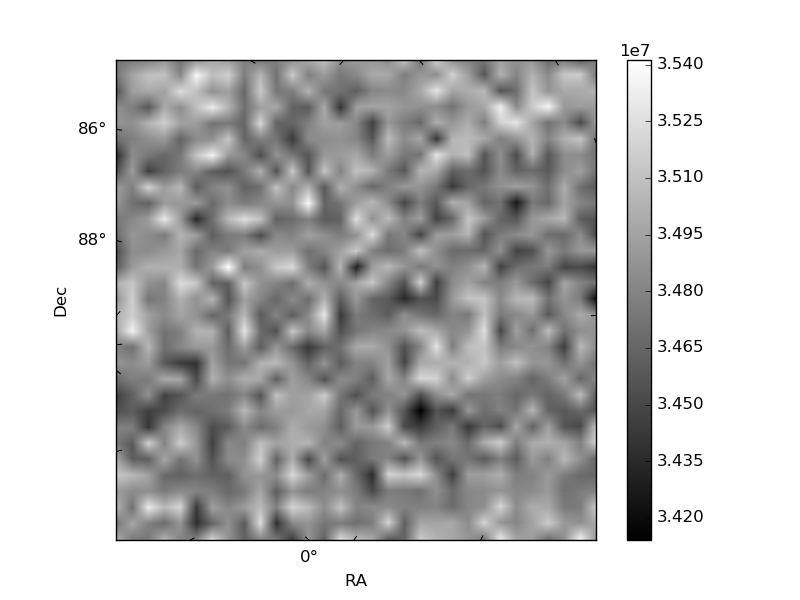
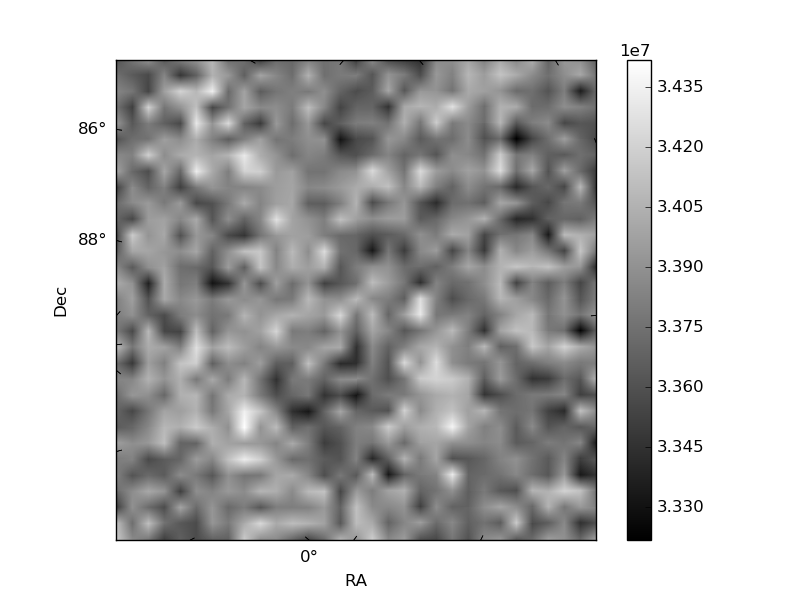
Histogram calculated using DETX and DETY for each event in the final _common_clean file
| Quadrant A | 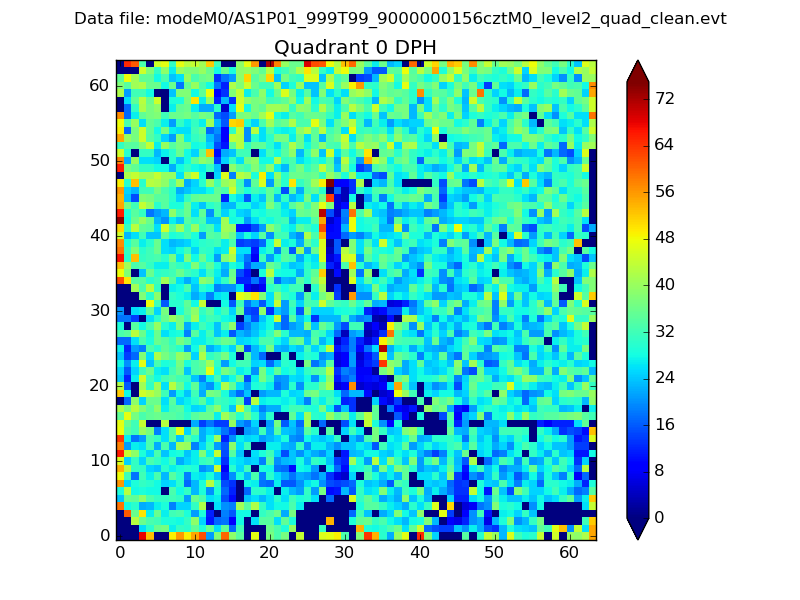 |
 |
Quadrant B |
|---|---|---|---|
| Quadrant D |  |
 |
Quadrant C |
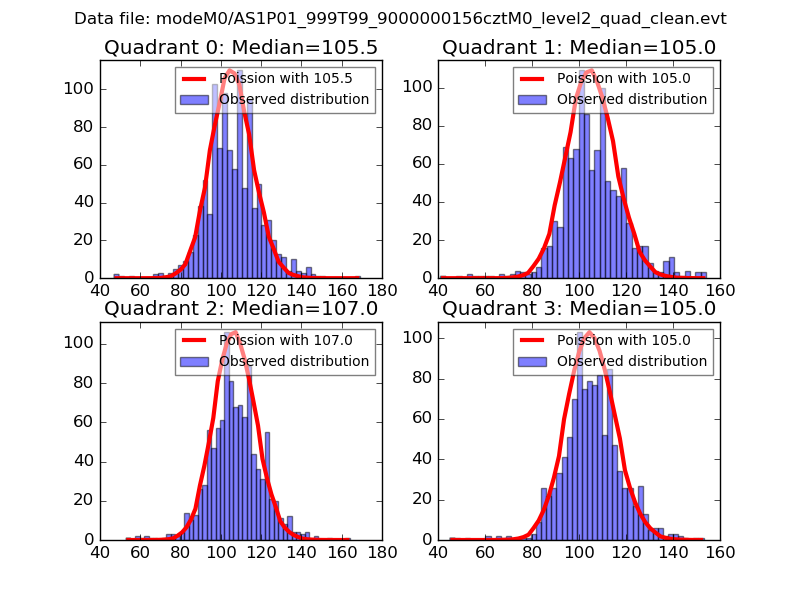
| Plot type | Count rate plots | Images |
|---|---|---|
| Comparison with Poisson distribution Blue bars denote a histogram of data divided into 1 sec bins. Red curve is a Poisson curve with rate = median count rate of data. |
 |
 |
| Quadrant-wise count rates Data is divided into 100 sec bins |
 |
|
| Module-wise count rates for Quadrant A Data is divided into 100 sec bins |
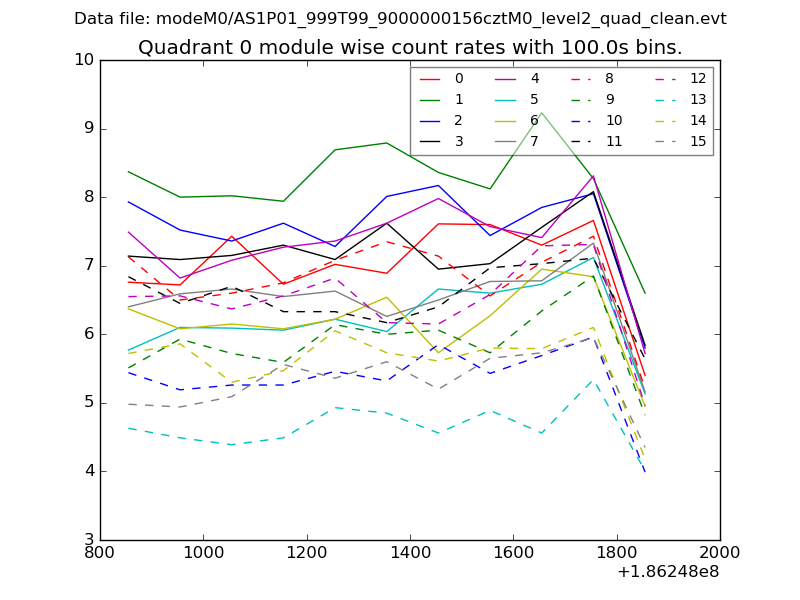 |
 |
| Module-wise count rates for Quadrant B Data is divided into 100 sec bins |
 |
 |
| Module-wise count rates for Quadrant C Data is divided into 100 sec bins |
 |
 |
| Module-wise count rates for Quadrant D Data is divided into 100 sec bins |
 |
 |
| Parameter | Plot |
|---|---|
| CZT HV Monitor |  |
| D_VDD |  |
| Temperature 1 | 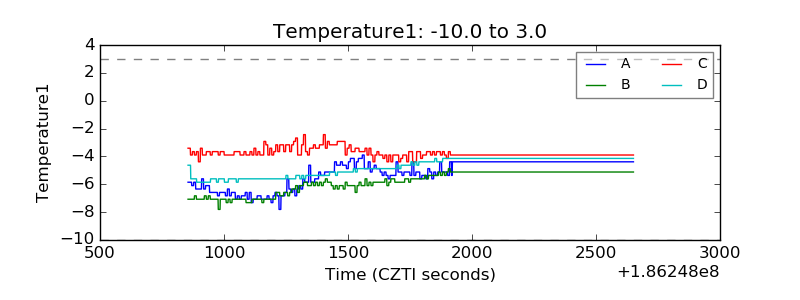 |
| Veto HV Monitor |  |
| Veto LLD |  |
| Alpha Counter |  |
| _CPM_Rate |  |
| CZT Counter |  |
| +2.5 Volts monitor | 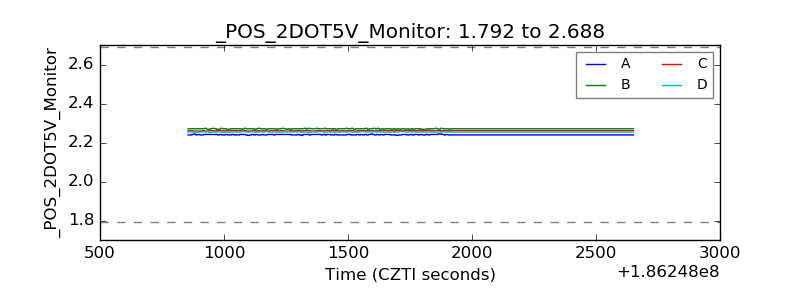 |
| +5 Volts monitor | 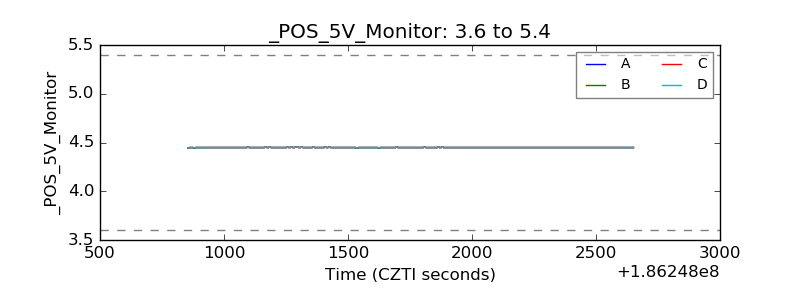 |
| _ROLL_ROT |  |
| _Roll_DEC |  |
| _Roll_RA |  |
| Veto Counter |  |