| Param | Original file | Final file |
|---|---|---|
| Filename | modeM0/AS1P01_999T99_9000000152cztM0_level2_bc.evt | modeM0/AS1P01_999T99_9000000152cztM0_level2_quad_clean.evt |
| Size (bytes) | 33,269,760 | 11,937,600 |
| Size | 31.7 MB | 11.4 MB |
| Events in quadrant A | 131,074 | 76,818 |
| Events in quadrant B | 396,830 | 74,616 |
| Events in quadrant C | 260,523 | 76,307 |
| Events in quadrant D | 160,817 | 74,617 |
| Mode M0 | |||
|---|---|---|---|
| Quadrant | BADHDUFLAG | Total packets | Discarded packets |
| A | 0 | 3565 | 0 |
| B | 0 | 4488 | 0 |
| C | 0 | 3708 | 0 |
| D | 0 | 3281 | 0 |
| Mode M9 | |||
|---|---|---|---|
| Quadrant | BADHDUFLAG | Total packets | Discarded packets |
| A | 0 | 12 | 0 |
| B | 0 | 12 | 0 |
| C | 0 | 12 | 0 |
| D | 0 | 12 | 0 |
| Mode SS | |||
|---|---|---|---|
| Quadrant | BADHDUFLAG | Total packets | Discarded packets |
| A | 0 | 16 | 0 |
| B | 0 | 16 | 0 |
| C | 0 | 16 | 0 |
| D | 0 | 16 | 0 |
| Quadrant | Total seconds | Saturated seconds | Saturation percentage |
|---|---|---|---|
| A | 736 | 29 | 3.940217% |
| B | 736 | 48 | 6.521739% |
| C | 736 | 33 | 4.483696% |
| D | 736 | 44 | 5.978261% |
Noise dominated data is calculated using 1-second bins in cleaned event files. If a bin has >2000 counts, and if more than 50% of those come from <1% of pixels, then it is considered to be noise-dominated and hence unusable.
| Quadrant | # 1 sec bins | Bins with >0 counts | Bins with >2000 counts | High rate bins dominated by noise | Noise dominated (total time) | Noise dominated (detector-on time) | Marked lightcurve |
|---|---|---|---|---|---|---|---|
| A | 735 | 735 | 0 | 0 | 0.00% | 0.00% |  |
| B | 735 | 735 | 3 | 3 | 0.41% | 0.41% |  |
| C | 735 | 735 | 0 | 0 | 0.00% | 0.00% |  |
| D | 735 | 735 | 0 | 0 | 0.00% | 0.00% | 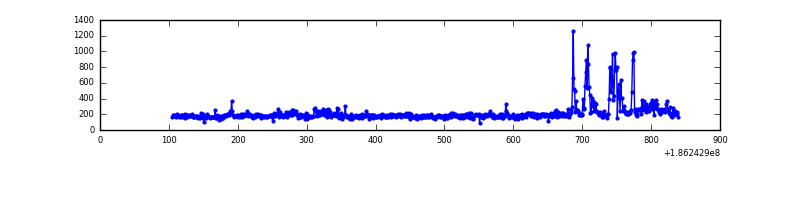 |
Top three noisy pixels from each quadrant. If the there are fewer than three noisy pixels in the level2.evt file, extra rows are filled as -1
| Pixel properties | Quadrant properties | ||||||
|---|---|---|---|---|---|---|---|
| Quadrant | DetID | PixID | Counts | Sigma | Mean | Median | Sigma |
| A | 8 | 35 | 94 | 6.47 | 34 | 33 | 9.4 |
| A | 5 | 44 | 83 | 5.31 | 34 | 33 | 9.4 |
| A | -1 | -1 | -1 | -1.0 | 34 | 33 | 9.4 |
| B | 8 | 38 | 260556 | 30574.02 | 34 | 33 | 8.5 |
| B | 0 | 157 | 2915 | 338.22 | 34 | 33 | 8.5 |
| B | 15 | 22 | 1300 | 148.69 | 34 | 33 | 8.5 |
| C | 8 | 208 | 100953 | 10807.62 | 33 | 33 | 9.3 |
| C | 3 | 143 | 15132 | 1616.97 | 33 | 33 | 9.3 |
| C | 9 | 52 | 3855 | 409.3 | 33 | 33 | 9.3 |
| D | 13 | 169 | 22714 | 2502.55 | 32 | 31 | 9.1 |
| D | 11 | 131 | 7430 | 816.31 | 32 | 31 | 9.1 |
| D | 13 | 170 | 4189 | 458.74 | 32 | 31 | 9.1 |
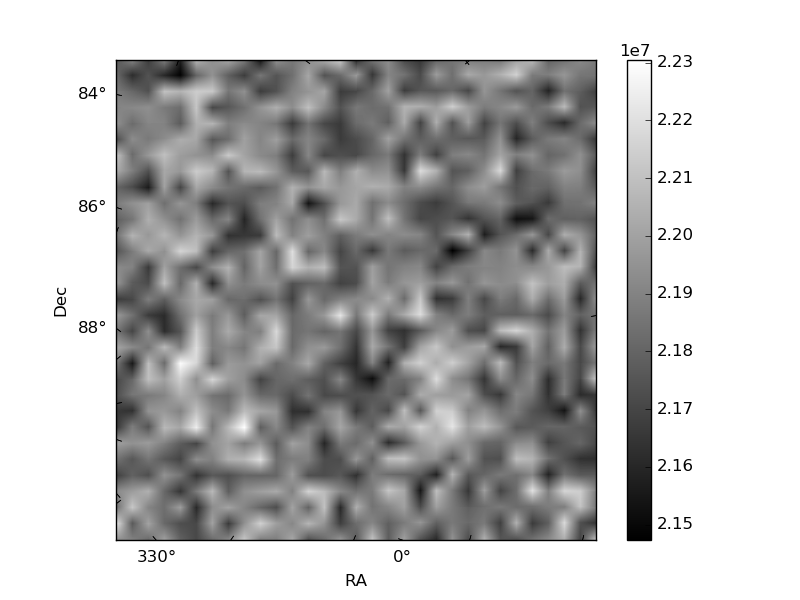
Histogram calculated using DETX and DETY for each event in the final _common_clean file
| Quadrant A |  |
 |
Quadrant B |
|---|---|---|---|
| Quadrant D |  |
 |
Quadrant C |
| Plot type | Count rate plots | Images |
|---|---|---|
| Comparison with Poisson distribution Blue bars denote a histogram of data divided into 1 sec bins. Red curve is a Poisson curve with rate = median count rate of data. |
 |
 |
| Quadrant-wise count rates Data is divided into 100 sec bins |
 |
|
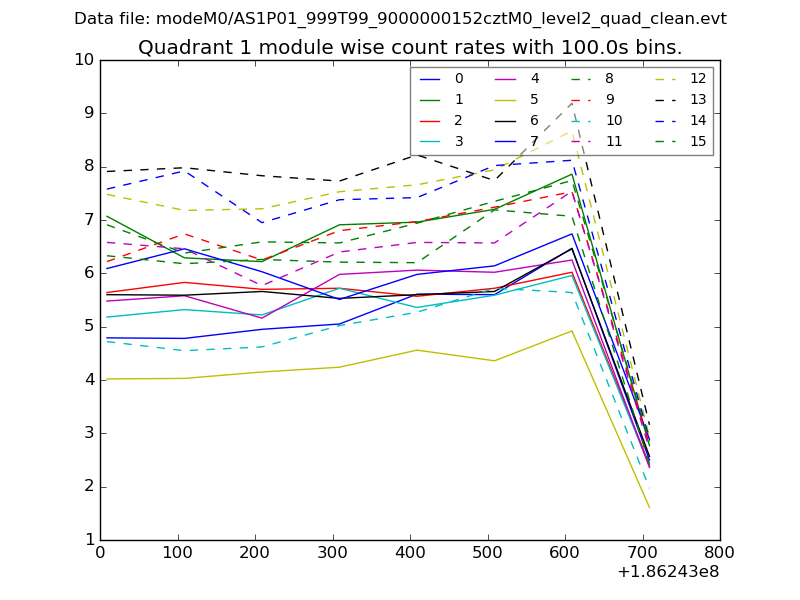
| Module-wise count rates for Quadrant A Data is divided into 100 sec bins |
 |
 |
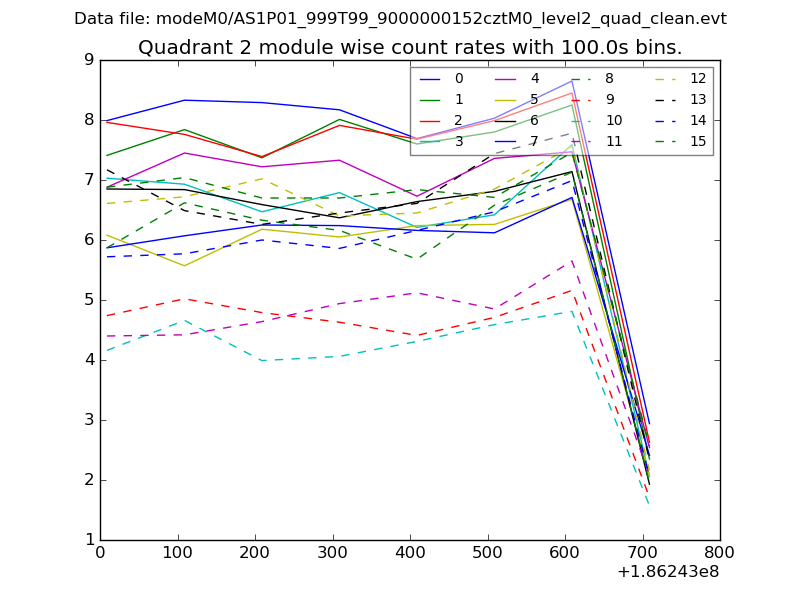
| Module-wise count rates for Quadrant B Data is divided into 100 sec bins |
 |
 |
| Module-wise count rates for Quadrant C Data is divided into 100 sec bins |
 |
 |
| Module-wise count rates for Quadrant D Data is divided into 100 sec bins |
 |
 |
| Parameter | Plot |
|---|---|
| CZT HV Monitor |  |
| D_VDD |  |
| Temperature 1 |  |
| Veto HV Monitor |  |
| Veto LLD |  |
| Alpha Counter | 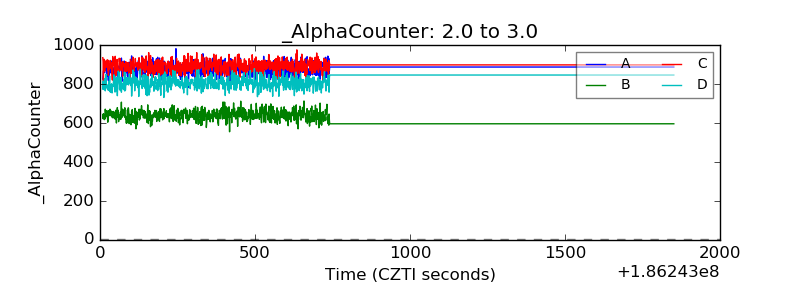 |
| _CPM_Rate |  |
| CZT Counter |  |
| +2.5 Volts monitor | 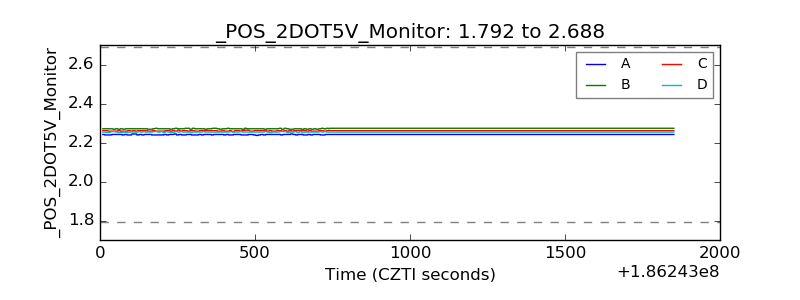 |
| +5 Volts monitor |  |
| _ROLL_ROT | 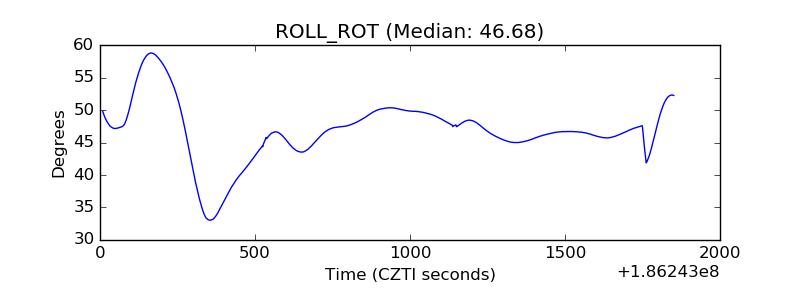 |
| _Roll_DEC |  |
| _Roll_RA |  |
| Veto Counter |  |