| Param | Original file | Final file |
|---|---|---|
| Filename | modeM0/AS1P01_999T99_9000000136cztM0_level2_bc.evt | modeM0/AS1P01_999T99_9000000136cztM0_level2_quad_clean.evt |
| Size (bytes) | 44,141,760 | 24,992,640 |
| Size | 42.1 MB | 23.8 MB |
| Events in quadrant A | 275,935 | 159,664 |
| Events in quadrant B | 310,296 | 161,733 |
| Events in quadrant C | 321,043 | 158,705 |
| Events in quadrant D | 307,624 | 153,893 |
| Mode SS | |||
|---|---|---|---|
| Quadrant | BADHDUFLAG | Total packets | Discarded packets |
| A | 0 | 34 | 0 |
| B | 0 | 34 | 0 |
| C | 0 | 34 | 0 |
| D | 0 | 34 | 0 |
| Mode M9 | |||
|---|---|---|---|
| Quadrant | BADHDUFLAG | Total packets | Discarded packets |
| A | 0 | 2 | 0 |
| B | 0 | 2 | 0 |
| C | 0 | 2 | 0 |
| D | 0 | 2 | 0 |
| Mode M0 | |||
|---|---|---|---|
| Quadrant | BADHDUFLAG | Total packets | Discarded packets |
| A | 0 | 7382 | 0 |
| B | 0 | 7556 | 0 |
| C | 0 | 6804 | 0 |
| D | 0 | 6538 | 0 |
| Quadrant | Total seconds | Saturated seconds | Saturation percentage |
|---|---|---|---|
| A | 1663 | 3 | 0.180397% |
| B | 1663 | 3 | 0.180397% |
| C | 1663 | 2 | 0.120265% |
| D | 1663 | 1 | 0.060132% |
Noise dominated data is calculated using 1-second bins in cleaned event files. If a bin has >2000 counts, and if more than 50% of those come from <1% of pixels, then it is considered to be noise-dominated and hence unusable.
| Quadrant | # 1 sec bins | Bins with >0 counts | Bins with >2000 counts | High rate bins dominated by noise | Noise dominated (total time) | Noise dominated (detector-on time) | Marked lightcurve |
|---|---|---|---|---|---|---|---|
| A | 1662 | 1662 | 0 | 0 | 0.00% | 0.00% | 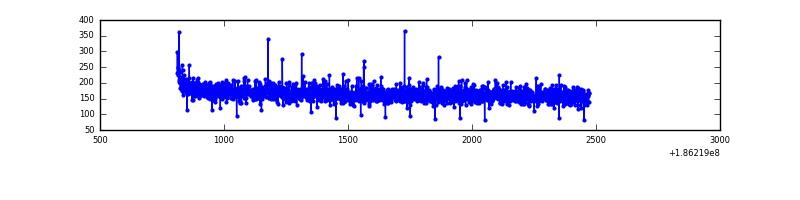 |
| B | 1662 | 1662 | 0 | 0 | 0.00% | 0.00% |  |
| C | 1662 | 1662 | 0 | 0 | 0.00% | 0.00% |  |
| D | 1662 | 1662 | 0 | 0 | 0.00% | 0.00% |  |
Top three noisy pixels from each quadrant. If the there are fewer than three noisy pixels in the level2.evt file, extra rows are filled as -1
| Pixel properties | Quadrant properties | ||||||
|---|---|---|---|---|---|---|---|
| Quadrant | DetID | PixID | Counts | Sigma | Mean | Median | Sigma |
| A | 14 | 170 | 460 | 22.8 | 71 | 69 | 17.1 |
| A | 10 | 133 | 336 | 15.57 | 71 | 69 | 17.1 |
| A | 15 | 17 | 248 | 10.44 | 71 | 69 | 17.1 |
| B | 0 | 220 | 16110 | 1011.62 | 73 | 70 | 15.9 |
| B | 5 | 249 | 2769 | 170.2 | 73 | 70 | 15.9 |
| B | 8 | 38 | 2483 | 152.16 | 73 | 70 | 15.9 |
| C | 12 | 4 | 32752 | 1938.31 | 70 | 68 | 16.9 |
| C | 15 | 241 | 3647 | 212.25 | 70 | 68 | 16.9 |
| C | 3 | 111 | 2090 | 119.91 | 70 | 68 | 16.9 |
| D | 13 | 169 | 11465 | 684.46 | 69 | 66 | 16.7 |
| D | 13 | 170 | 11458 | 684.04 | 69 | 66 | 16.7 |
| D | 1 | 4 | 9256 | 551.82 | 69 | 66 | 16.7 |
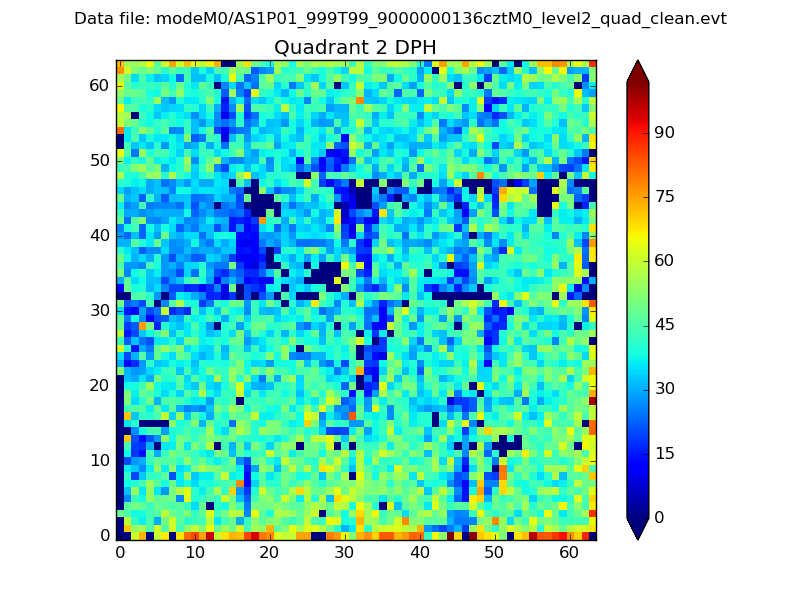
Histogram calculated using DETX and DETY for each event in the final _common_clean file
| Quadrant A |  |
 |
Quadrant B |
|---|---|---|---|
| Quadrant D |  |
 |
Quadrant C |
| Plot type | Count rate plots | Images |
|---|---|---|
| Comparison with Poisson distribution Blue bars denote a histogram of data divided into 1 sec bins. Red curve is a Poisson curve with rate = median count rate of data. |
 |
 |
| Quadrant-wise count rates Data is divided into 100 sec bins |
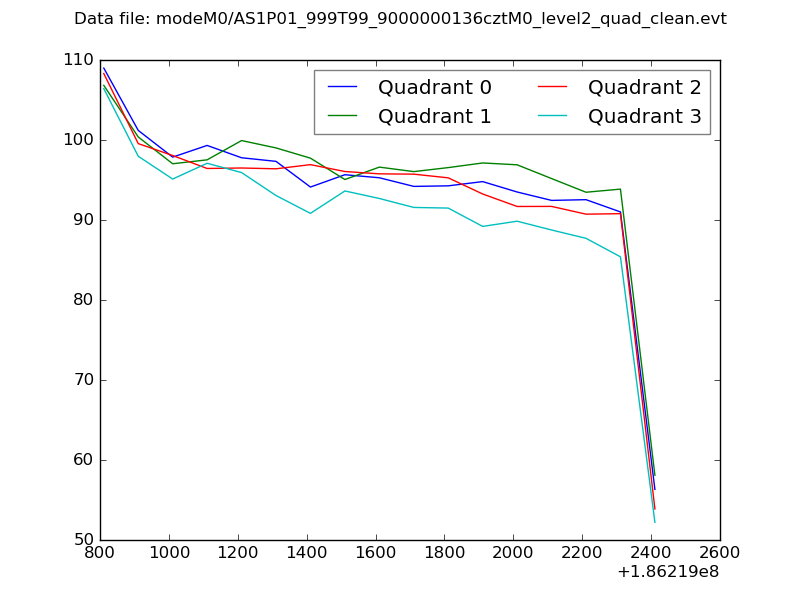 |
|
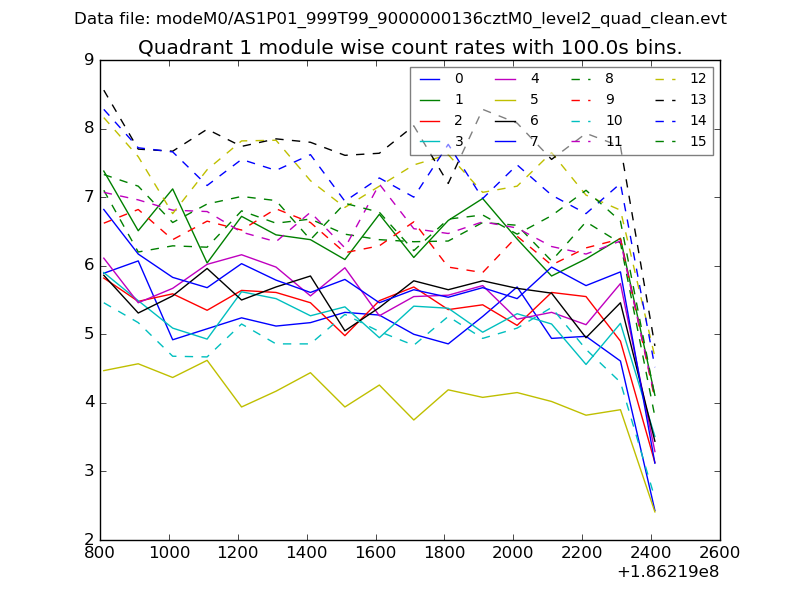
| Module-wise count rates for Quadrant A Data is divided into 100 sec bins |
 |
 |
| Module-wise count rates for Quadrant B Data is divided into 100 sec bins |
 |
 |
| Module-wise count rates for Quadrant C Data is divided into 100 sec bins |
 |
 |
| Module-wise count rates for Quadrant D Data is divided into 100 sec bins |
 |
 |
| Parameter | Plot |
|---|---|
| CZT HV Monitor | 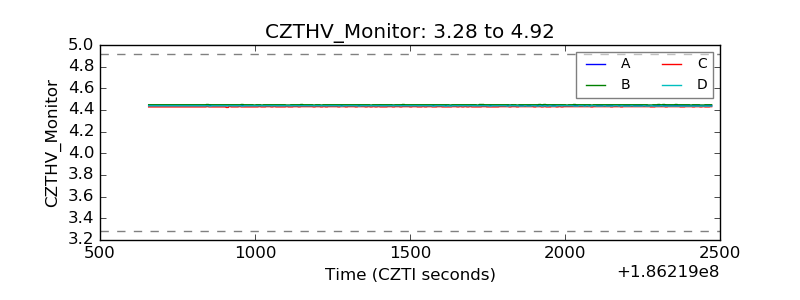 |
| D_VDD |  |
| Temperature 1 |  |
| Veto HV Monitor |  |
| Veto LLD |  |
| Alpha Counter | 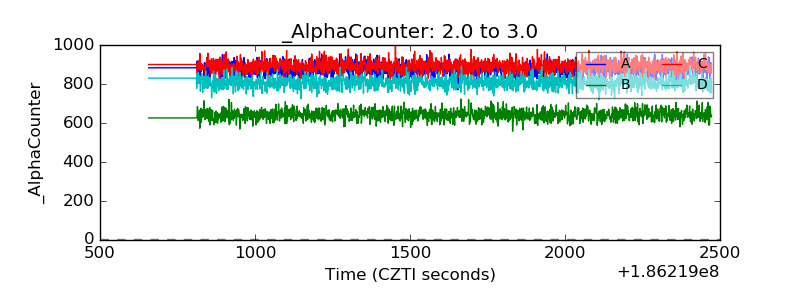 |
| _CPM_Rate | 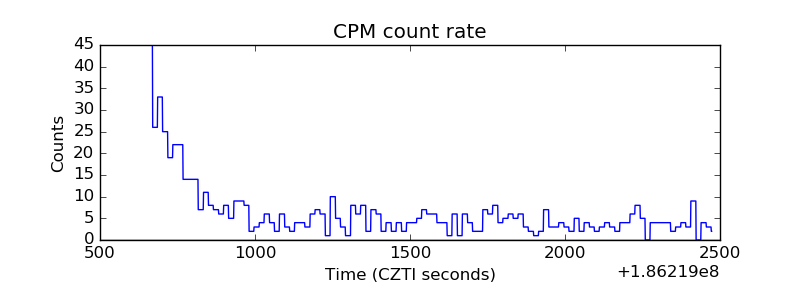 |
| CZT Counter | 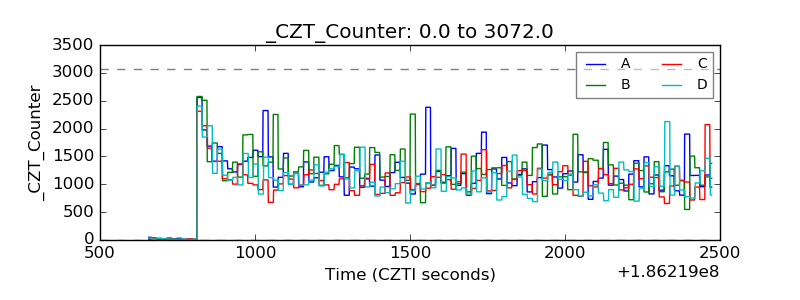 |
| +2.5 Volts monitor |  |
| +5 Volts monitor |  |
| _ROLL_ROT |  |
| _Roll_DEC |  |
| _Roll_RA |  |
| Veto Counter |  |