| Param | Original file | Final file |
|---|---|---|
| Filename | modeM0/AS1P01_999T99_9000000128cztM0_level2_bc.evt | modeM0/AS1P01_999T99_9000000128cztM0_level2_quad_clean.evt |
| Size (bytes) | 130,550,400 | 29,707,200 |
| Size | 124.5 MB | 28.3 MB |
| Events in quadrant A | 344,765 | 200,678 |
| Events in quadrant B | 361,480 | 203,332 |
| Events in quadrant C | 2,717,633 | 135,952 |
| Events in quadrant D | 369,758 | 197,823 |
| Mode M0 | |||
|---|---|---|---|
| Quadrant | BADHDUFLAG | Total packets | Discarded packets |
| A | 0 | 8878 | 0 |
| B | 0 | 9056 | 0 |
| C | 0 | 16417 | 0 |
| D | 0 | 7732 | 0 |
| Mode SS | |||
|---|---|---|---|
| Quadrant | BADHDUFLAG | Total packets | Discarded packets |
| A | 0 | 44 | 0 |
| B | 0 | 44 | 0 |
| C | 0 | 44 | 0 |
| D | 0 | 44 | 0 |
| Quadrant | Total seconds | Saturated seconds | Saturation percentage |
|---|---|---|---|
| A | 2230 | 1 | 0.044843% |
| B | 2230 | 0 | 0.000000% |
| C | 2230 | 1101 | 49.372197% |
| D | 2230 | 0 | 0.000000% |
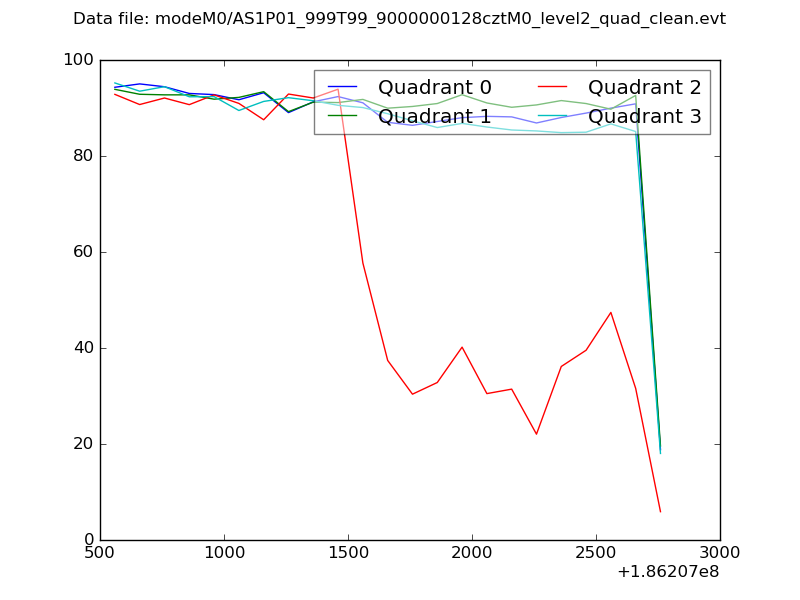
Noise dominated data is calculated using 1-second bins in cleaned event files. If a bin has >2000 counts, and if more than 50% of those come from <1% of pixels, then it is considered to be noise-dominated and hence unusable.
| Quadrant | # 1 sec bins | Bins with >0 counts | Bins with >2000 counts | High rate bins dominated by noise | Noise dominated (total time) | Noise dominated (detector-on time) | Marked lightcurve |
|---|---|---|---|---|---|---|---|
| A | 2230 | 2230 | 0 | 0 | 0.00% | 0.00% |  |
| B | 2230 | 2230 | 0 | 0 | 0.00% | 0.00% | 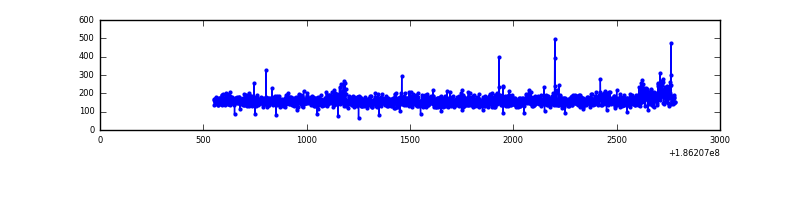 |
| C | 2229 | 2229 | 538 | 538 | 24.14% | 24.14% | 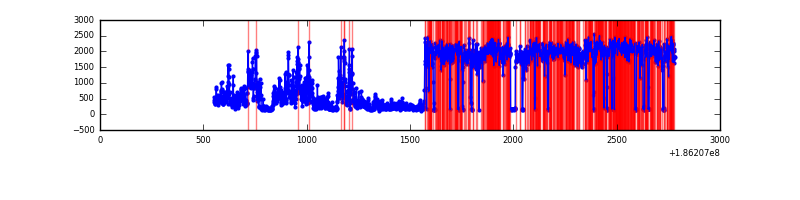 |
| D | 2230 | 2230 | 0 | 0 | 0.00% | 0.00% |  |
Top three noisy pixels from each quadrant. If the there are fewer than three noisy pixels in the level2.evt file, extra rows are filled as -1
| Pixel properties | Quadrant properties | ||||||
|---|---|---|---|---|---|---|---|
| Quadrant | DetID | PixID | Counts | Sigma | Mean | Median | Sigma |
| A | 13 | 9 | 983 | 43.5 | 89 | 87 | 20.6 |
| A | 10 | 133 | 381 | 14.27 | 89 | 87 | 20.6 |
| A | 14 | 79 | 374 | 13.93 | 89 | 87 | 20.6 |
| B | 0 | 220 | 5374 | 279.36 | 91 | 88 | 18.9 |
| B | 15 | 22 | 2579 | 131.65 | 91 | 88 | 18.9 |
| B | 0 | 190 | 2001 | 101.1 | 91 | 88 | 18.9 |
| C | 9 | 83 | 2458162 | 157065.87 | 62 | 61 | 15.7 |
| C | 15 | 241 | 3902 | 245.43 | 62 | 61 | 15.7 |
| C | 1 | 192 | 3250 | 203.77 | 62 | 61 | 15.7 |
| D | 1 | 4 | 24142 | 1120.26 | 87 | 84 | 21.5 |
| D | 12 | 188 | 6049 | 277.76 | 87 | 84 | 21.5 |
| D | 10 | 114 | 2330 | 104.58 | 87 | 84 | 21.5 |
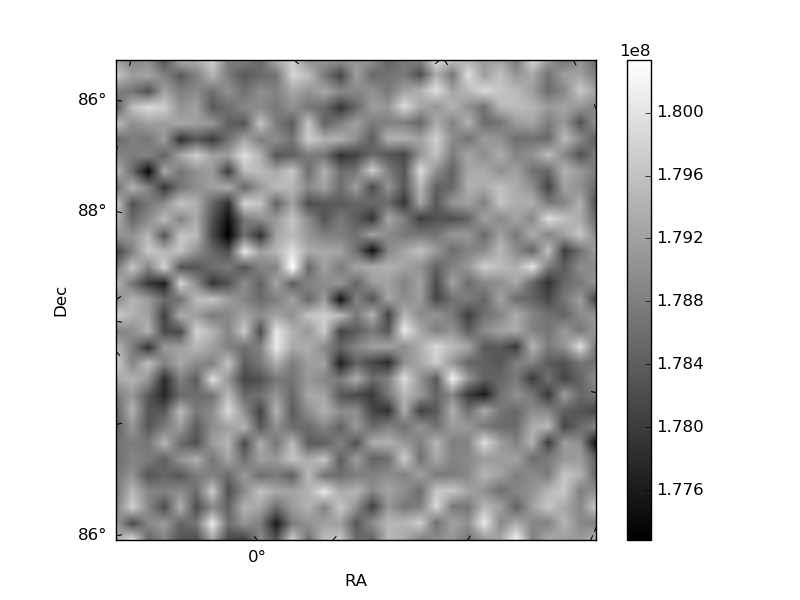
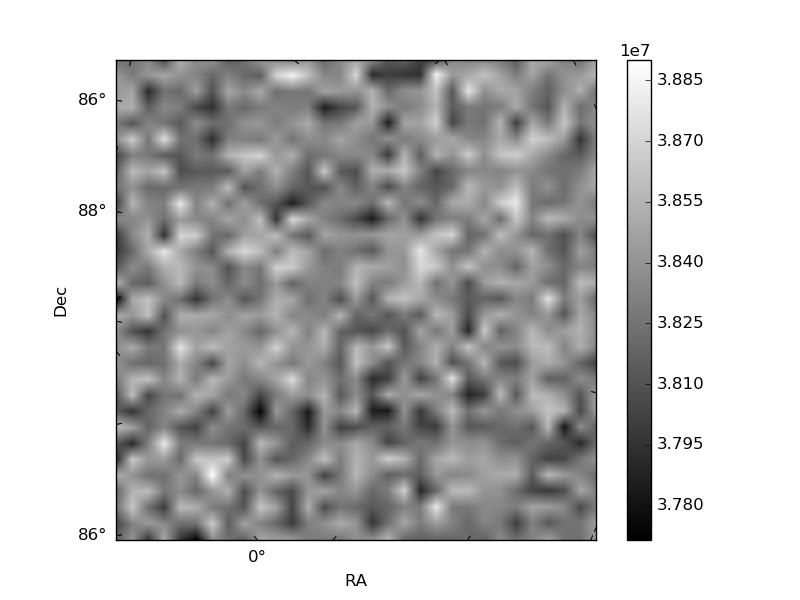
Histogram calculated using DETX and DETY for each event in the final _common_clean file
| Quadrant A |  |
 |
Quadrant B |
|---|---|---|---|
| Quadrant D |  |
 |
Quadrant C |
| Plot type | Count rate plots | Images |
|---|---|---|
| Comparison with Poisson distribution Blue bars denote a histogram of data divided into 1 sec bins. Red curve is a Poisson curve with rate = median count rate of data. |
 |
 |
| Quadrant-wise count rates Data is divided into 100 sec bins |
 |
|
| Module-wise count rates for Quadrant A Data is divided into 100 sec bins |
 |
 |
| Module-wise count rates for Quadrant B Data is divided into 100 sec bins |
 |
 |
| Module-wise count rates for Quadrant C Data is divided into 100 sec bins |
 |
 |
| Module-wise count rates for Quadrant D Data is divided into 100 sec bins |
 |
 |
| Parameter | Plot |
|---|---|
| CZT HV Monitor |  |
| D_VDD |  |
| Temperature 1 | 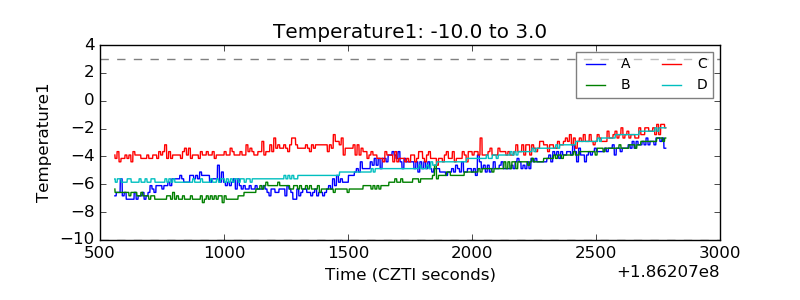 |
| Veto HV Monitor |  |
| Veto LLD |  |
| Alpha Counter | 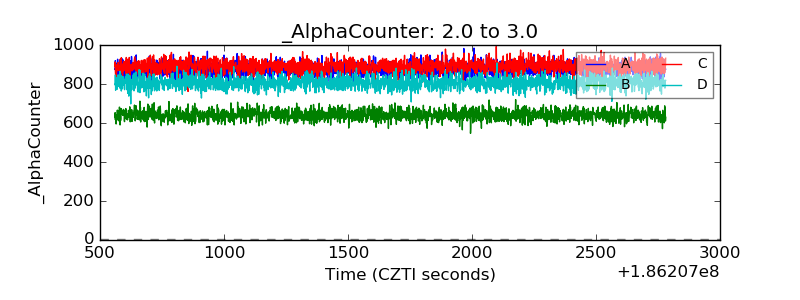 |
| _CPM_Rate | 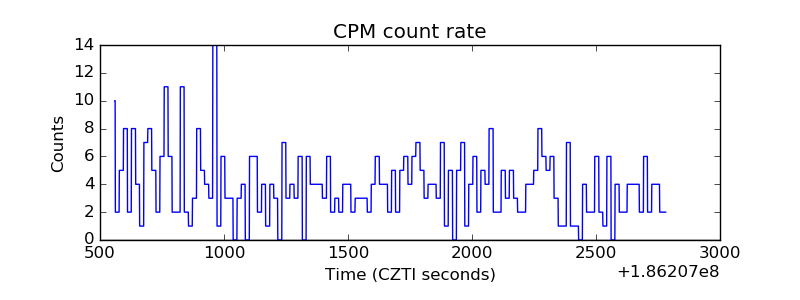 |
| CZT Counter |  |
| +2.5 Volts monitor |  |
| +5 Volts monitor | 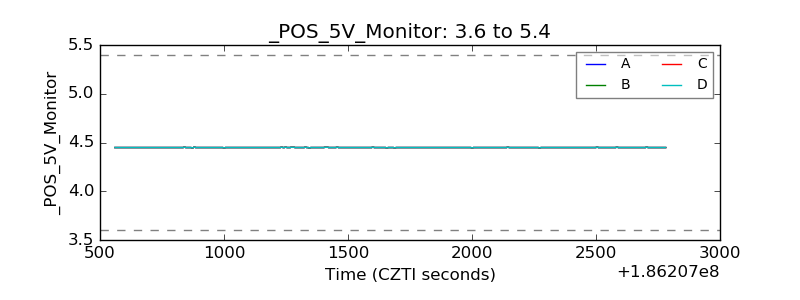 |
| _ROLL_ROT |  |
| _Roll_DEC |  |
| _Roll_RA | 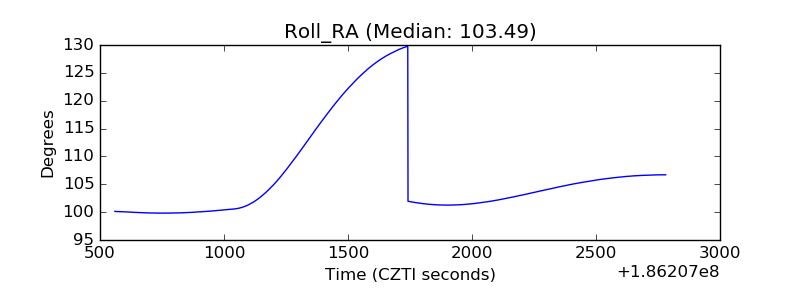 |
| Veto Counter | 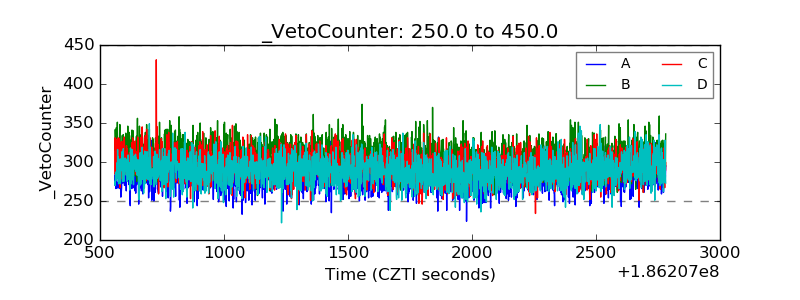 |