| Param | Original file | Final file |
|---|---|---|
| Filename | modeM0/AS1P01_889T01_9000000174cztM0_level2.evt | modeM0/AS1P01_889T01_9000000174cztM0_level2_quad_clean.evt |
| Size (bytes) | 300,326,400 | 28,699,200 |
| Size | 286.4 MB | 27.4 MB |
| Events in quadrant A | 2,108,974 | 191,689 |
| Events in quadrant B | 2,881,618 | 183,619 |
| Events in quadrant C | 2,041,538 | 189,043 |
| Events in quadrant D | 1,952,581 | 184,086 |
| Mode SS | |||
|---|---|---|---|
| Quadrant | BADHDUFLAG | Total packets | Discarded packets |
| A | 0 | 34 | 0 |
| B | 0 | 34 | 0 |
| C | 0 | 34 | 0 |
| D | 0 | 34 | 0 |
| Mode M9 | |||
|---|---|---|---|
| Quadrant | BADHDUFLAG | Total packets | Discarded packets |
| A | 0 | 4 | 0 |
| B | 0 | 4 | 0 |
| C | 0 | 4 | 0 |
| D | 0 | 4 | 0 |
| Mode M0 | |||
|---|---|---|---|
| Quadrant | BADHDUFLAG | Total packets | Discarded packets |
| A | 0 | 7406 | 0 |
| B | 0 | 9716 | 0 |
| C | 0 | 7224 | 0 |
| D | 0 | 6956 | 0 |
| Quadrant | Total seconds | Saturated seconds | Saturation percentage |
|---|---|---|---|
| A | 1635 | 1 | 0.061162% |
| B | 1635 | 166 | 10.152905% |
| C | 1634 | 5 | 0.305998% |
| D | 1635 | 3 | 0.183486% |
Noise dominated data is calculated using 1-second bins in cleaned event files. If a bin has >2000 counts, and if more than 50% of those come from <1% of pixels, then it is considered to be noise-dominated and hence unusable.
| Quadrant | # 1 sec bins | Bins with >0 counts | Bins with >2000 counts | High rate bins dominated by noise | Noise dominated (total time) | Noise dominated (detector-on time) | Marked lightcurve |
|---|---|---|---|---|---|---|---|
| A | 2050 | 1636 | 142 | 142 | 6.93% | 8.68% |  |
| B | 2050 | 1636 | 512 | 512 | 24.98% | 31.30% |  |
| C | 2050 | 1636 | 128 | 128 | 6.24% | 7.82% | 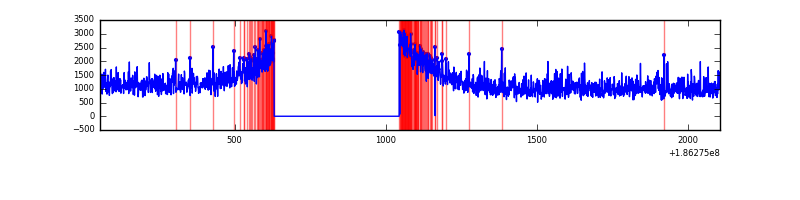 |
| D | 2050 | 1636 | 115 | 115 | 5.61% | 7.03% |  |
Top three noisy pixels from each quadrant. If the there are fewer than three noisy pixels in the level2.evt file, extra rows are filled as -1
| Pixel properties | Quadrant properties | ||||||
|---|---|---|---|---|---|---|---|
| Quadrant | DetID | PixID | Counts | Sigma | Mean | Median | Sigma |
| A | 8 | 192 | 4039 | 25.73 | 547 | 550 | 135.6 |
| A | 11 | 79 | 2697 | 15.83 | 547 | 550 | 135.6 |
| A | 10 | 133 | 1777 | 9.05 | 547 | 550 | 135.6 |
| B | 3 | 0 | 605650 | 4406.34 | 564 | 566 | 137.3 |
| B | 5 | 249 | 52830 | 380.59 | 564 | 566 | 137.3 |
| B | 8 | 38 | 38193 | 274.0 | 564 | 566 | 137.3 |
| C | 15 | 241 | 6716 | 42.24 | 514 | 534 | 146.4 |
| C | 3 | 111 | 6042 | 37.63 | 514 | 534 | 146.4 |
| C | 7 | 159 | 4941 | 30.11 | 514 | 534 | 146.4 |
| D | 12 | 188 | 75915 | 484.89 | 492 | 508 | 155.5 |
| D | 1 | 4 | 25089 | 158.06 | 492 | 508 | 155.5 |
| D | 13 | 170 | 5996 | 35.29 | 492 | 508 | 155.5 |
Histogram calculated using DETX and DETY for each event in the final _common_clean file
| Quadrant A |  |
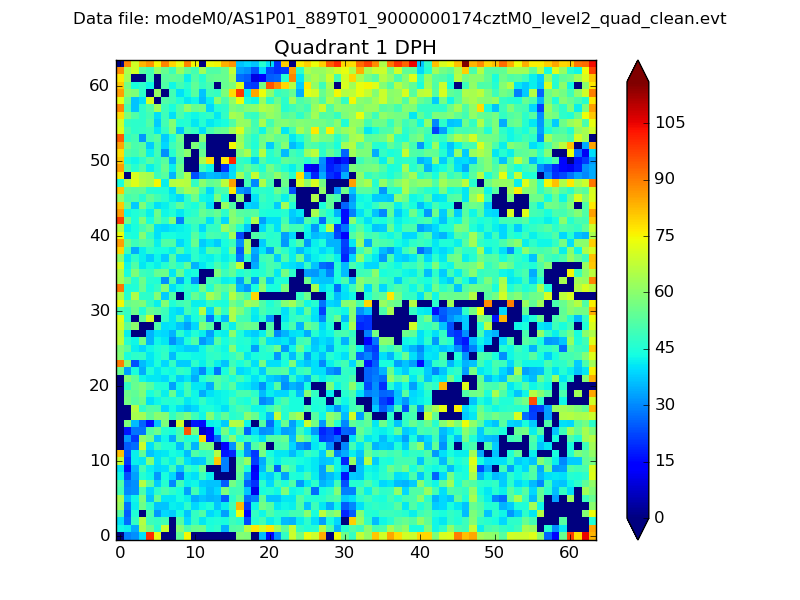 |
Quadrant B |
|---|---|---|---|
| Quadrant D |  |
 |
Quadrant C |
| Plot type | Count rate plots | Images |
|---|---|---|
| Comparison with Poisson distribution Blue bars denote a histogram of data divided into 1 sec bins. Red curve is a Poisson curve with rate = median count rate of data. |
 |
 |
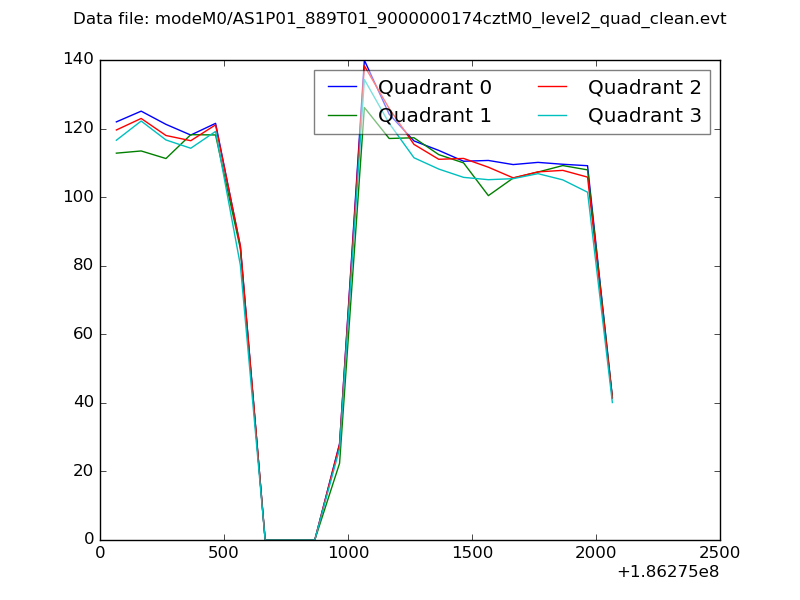
| Quadrant-wise count rates Data is divided into 100 sec bins |
 |
|
| Module-wise count rates for Quadrant A Data is divided into 100 sec bins |
 |
 |
| Module-wise count rates for Quadrant B Data is divided into 100 sec bins |
 |
 |
| Module-wise count rates for Quadrant C Data is divided into 100 sec bins |
 |
 |
| Module-wise count rates for Quadrant D Data is divided into 100 sec bins |
 |
 |
| Parameter | Plot |
|---|---|
| CZT HV Monitor | 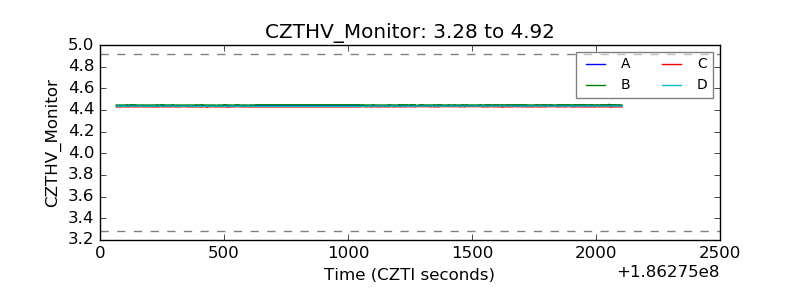 |
| D_VDD | 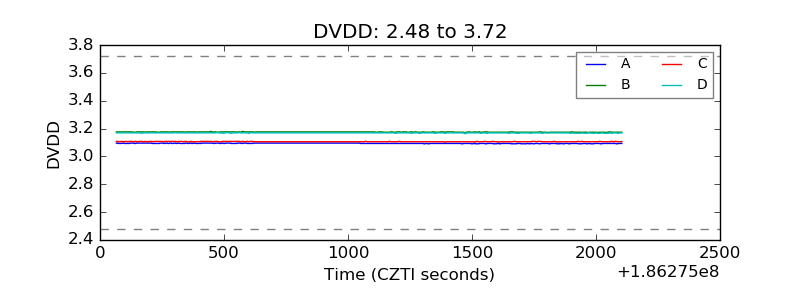 |
| Temperature 1 | 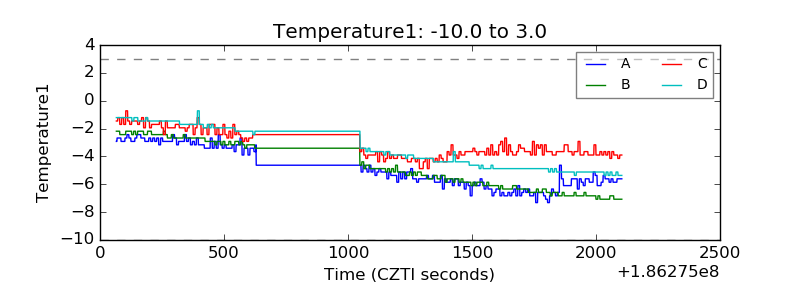 |
| Veto HV Monitor |  |
| Veto LLD |  |
| Alpha Counter | 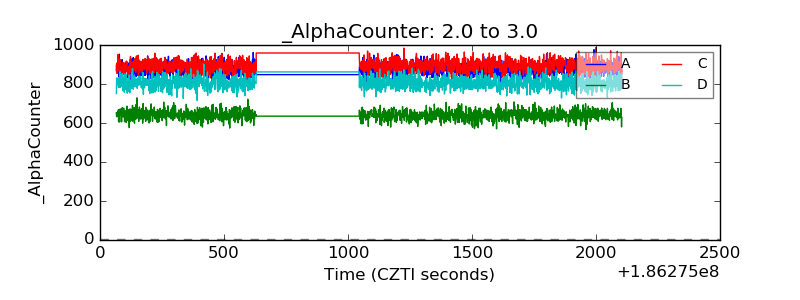 |
| _CPM_Rate |  |
| CZT Counter | 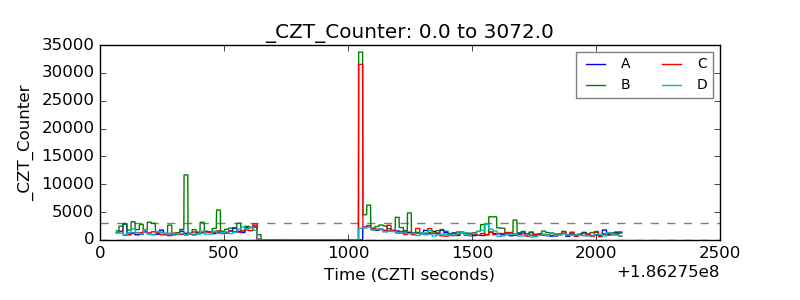 |
| +2.5 Volts monitor |  |
| +5 Volts monitor |  |
| _ROLL_ROT |  |
| _Roll_DEC |  |
| _Roll_RA |  |
| Veto Counter |  |