| Param | Original file | Final file |
|---|---|---|
| Filename | modeM0/AS1P01_889T01_9000000158cztM0_level2_bc.evt | modeM0/AS1P01_889T01_9000000158cztM0_level2_quad_clean.evt |
| Size (bytes) | 84,000,960 | 33,393,600 |
| Size | 80.1 MB | 31.8 MB |
| Events in quadrant A | 379,614 | 220,911 |
| Events in quadrant B | 1,087,739 | 201,868 |
| Events in quadrant C | 422,878 | 222,407 |
| Events in quadrant D | 506,217 | 217,249 |
| Mode SS | |||
|---|---|---|---|
| Quadrant | BADHDUFLAG | Total packets | Discarded packets |
| A | 0 | 40 | 0 |
| B | 0 | 40 | 0 |
| C | 0 | 40 | 0 |
| D | 0 | 40 | 0 |
| Mode M0 | |||
|---|---|---|---|
| Quadrant | BADHDUFLAG | Total packets | Discarded packets |
| A | 0 | 7800 | 0 |
| B | 0 | 12095 | 0 |
| C | 0 | 7450 | 0 |
| D | 0 | 7469 | 0 |
| Quadrant | Total seconds | Saturated seconds | Saturation percentage |
|---|---|---|---|
| A | 2046 | 0 | 0.000000% |
| B | 2046 | 342 | 16.715543% |
| C | 2046 | 1 | 0.048876% |
| D | 2046 | 4 | 0.195503% |
Noise dominated data is calculated using 1-second bins in cleaned event files. If a bin has >2000 counts, and if more than 50% of those come from <1% of pixels, then it is considered to be noise-dominated and hence unusable.
| Quadrant | # 1 sec bins | Bins with >0 counts | Bins with >2000 counts | High rate bins dominated by noise | Noise dominated (total time) | Noise dominated (detector-on time) | Marked lightcurve |
|---|---|---|---|---|---|---|---|
| A | 2045 | 2045 | 0 | 0 | 0.00% | 0.00% |  |
| B | 2045 | 2045 | 1 | 1 | 0.05% | 0.05% | 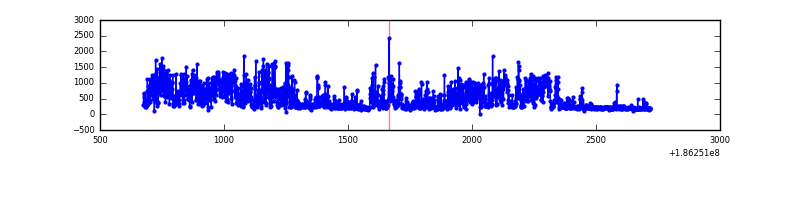 |
| C | 2045 | 2045 | 0 | 0 | 0.00% | 0.00% |  |
| D | 2045 | 2045 | 0 | 0 | 0.00% | 0.00% |  |
Top three noisy pixels from each quadrant. If the there are fewer than three noisy pixels in the level2.evt file, extra rows are filled as -1
| Pixel properties | Quadrant properties | ||||||
|---|---|---|---|---|---|---|---|
| Quadrant | DetID | PixID | Counts | Sigma | Mean | Median | Sigma |
| A | 3 | 80 | 3215 | 140.4 | 97 | 95 | 22.2 |
| A | 14 | 170 | 1923 | 82.26 | 97 | 95 | 22.2 |
| A | 14 | 79 | 597 | 22.59 | 97 | 95 | 22.2 |
| B | 3 | 0 | 514641 | 28162.49 | 91 | 89 | 18.3 |
| B | 8 | 38 | 153625 | 8403.34 | 91 | 89 | 18.3 |
| B | 4 | 222 | 22198 | 1210.07 | 91 | 89 | 18.3 |
| C | 2 | 53 | 14853 | 665.88 | 97 | 96 | 22.2 |
| C | 3 | 79 | 6574 | 292.31 | 97 | 96 | 22.2 |
| C | 3 | 111 | 5679 | 251.92 | 97 | 96 | 22.2 |
| D | 13 | 170 | 78869 | 3444.73 | 96 | 94 | 22.9 |
| D | 1 | 4 | 24676 | 1074.94 | 96 | 94 | 22.9 |
| D | 13 | 13 | 7617 | 328.97 | 96 | 94 | 22.9 |
Histogram calculated using DETX and DETY for each event in the final _common_clean file
| Quadrant A |  |
 |
Quadrant B |
|---|---|---|---|
| Quadrant D |  |
 |
Quadrant C |
| Plot type | Count rate plots | Images |
|---|---|---|
| Comparison with Poisson distribution Blue bars denote a histogram of data divided into 1 sec bins. Red curve is a Poisson curve with rate = median count rate of data. |
 |
 |
| Quadrant-wise count rates Data is divided into 100 sec bins |
 |
|
| Module-wise count rates for Quadrant A Data is divided into 100 sec bins |
 |
 |
| Module-wise count rates for Quadrant B Data is divided into 100 sec bins |
 |
 |
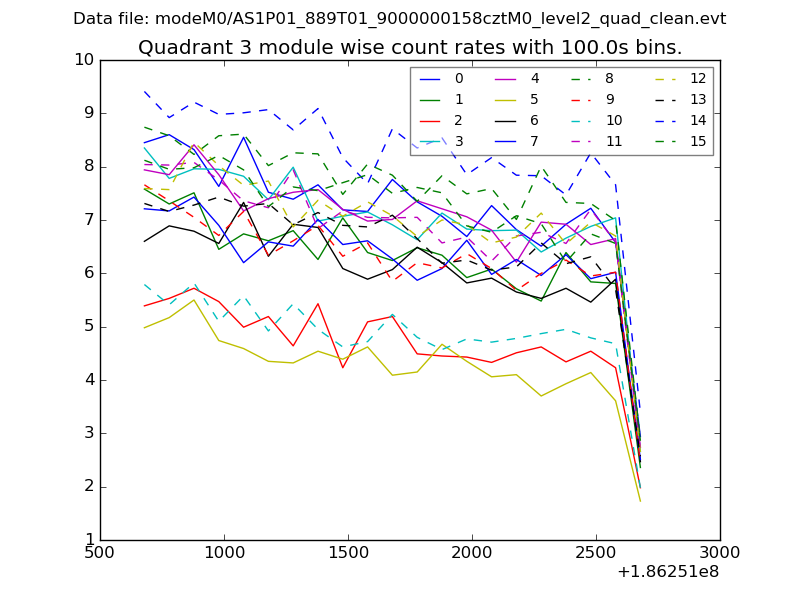
| Module-wise count rates for Quadrant C Data is divided into 100 sec bins |
 |
 |
| Module-wise count rates for Quadrant D Data is divided into 100 sec bins |
 |
 |
| Parameter | Plot |
|---|---|
| CZT HV Monitor |  |
| D_VDD |  |
| Temperature 1 |  |
| Veto HV Monitor |  |
| Veto LLD |  |
| Alpha Counter |  |
| _CPM_Rate |  |
| CZT Counter |  |
| +2.5 Volts monitor |  |
| +5 Volts monitor |  |
| _ROLL_ROT | 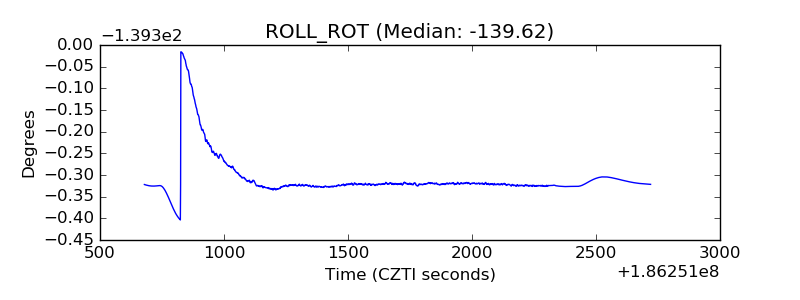 |
| _Roll_DEC | 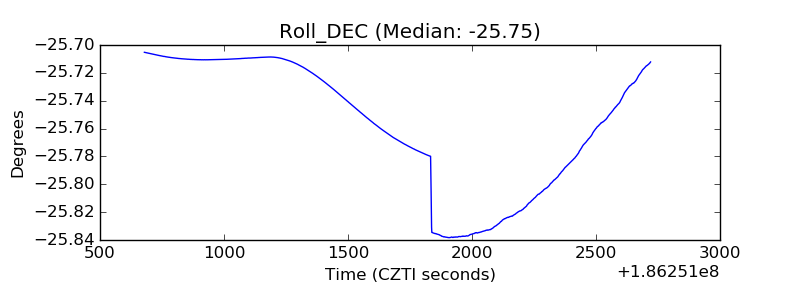 |
| _Roll_RA |  |
| Veto Counter |  |