| Param | Original file | Final file |
|---|---|---|
| Filename | modeM0/AS1P01_889T01_9000000146cztM0_level2.evt | modeM0/AS1P01_889T01_9000000146cztM0_level2_quad_clean.evt |
| Size (bytes) | 297,167,040 | 33,986,880 |
| Size | 283.4 MB | 32.4 MB |
| Events in quadrant A | 2,043,163 | 224,835 |
| Events in quadrant B | 2,610,892 | 219,930 |
| Events in quadrant C | 2,102,897 | 219,331 |
| Events in quadrant D | 2,103,763 | 216,034 |
| Mode M0 | |||
|---|---|---|---|
| Quadrant | BADHDUFLAG | Total packets | Discarded packets |
| A | 0 | 7555 | 0 |
| B | 0 | 9227 | 0 |
| C | 0 | 7705 | 0 |
| D | 0 | 7748 | 0 |
| Mode SS | |||
|---|---|---|---|
| Quadrant | BADHDUFLAG | Total packets | Discarded packets |
| A | 0 | 42 | 0 |
| B | 0 | 42 | 0 |
| C | 0 | 42 | 0 |
| D | 0 | 42 | 0 |
| Quadrant | Total seconds | Saturated seconds | Saturation percentage |
|---|---|---|---|
| A | 2044 | 1 | 0.048924% |
| B | 2044 | 56 | 2.739726% |
| C | 2044 | 0 | 0.000000% |
| D | 2044 | 27 | 1.320939% |
Noise dominated data is calculated using 1-second bins in cleaned event files. If a bin has >2000 counts, and if more than 50% of those come from <1% of pixels, then it is considered to be noise-dominated and hence unusable.
| Quadrant | # 1 sec bins | Bins with >0 counts | Bins with >2000 counts | High rate bins dominated by noise | Noise dominated (total time) | Noise dominated (detector-on time) | Marked lightcurve |
|---|---|---|---|---|---|---|---|
| A | 2044 | 2044 | 7 | 7 | 0.34% | 0.34% |  |
| B | 2044 | 2044 | 150 | 150 | 7.34% | 7.34% |  |
| C | 2044 | 2044 | 19 | 19 | 0.93% | 0.93% | 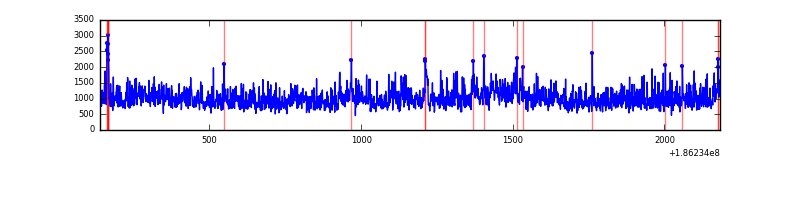 |
| D | 2044 | 2044 | 71 | 71 | 3.47% | 3.47% |  |
Top three noisy pixels from each quadrant. If the there are fewer than three noisy pixels in the level2.evt file, extra rows are filled as -1
| Pixel properties | Quadrant properties | ||||||
|---|---|---|---|---|---|---|---|
| Quadrant | DetID | PixID | Counts | Sigma | Mean | Median | Sigma |
| A | 11 | 79 | 2051 | 11.61 | 532 | 538 | 130.3 |
| A | 3 | 111 | 1635 | 8.42 | 532 | 538 | 130.3 |
| A | 14 | 203 | 1290 | 5.77 | 532 | 538 | 130.3 |
| B | 8 | 38 | 454962 | 3451.98 | 551 | 555 | 131.6 |
| B | 0 | 220 | 34201 | 255.6 | 551 | 555 | 131.6 |
| B | 15 | 85 | 6674 | 46.48 | 551 | 555 | 131.6 |
| C | 8 | 208 | 180733 | 1351.11 | 478 | 494 | 133.4 |
| C | 9 | 83 | 19168 | 139.98 | 478 | 494 | 133.4 |
| C | 3 | 79 | 9931 | 70.74 | 478 | 494 | 133.4 |
| D | 7 | 207 | 223319 | 1547.26 | 463 | 477 | 144.0 |
| D | 1 | 4 | 51828 | 356.54 | 463 | 477 | 144.0 |
| D | 13 | 170 | 22392 | 152.16 | 463 | 477 | 144.0 |
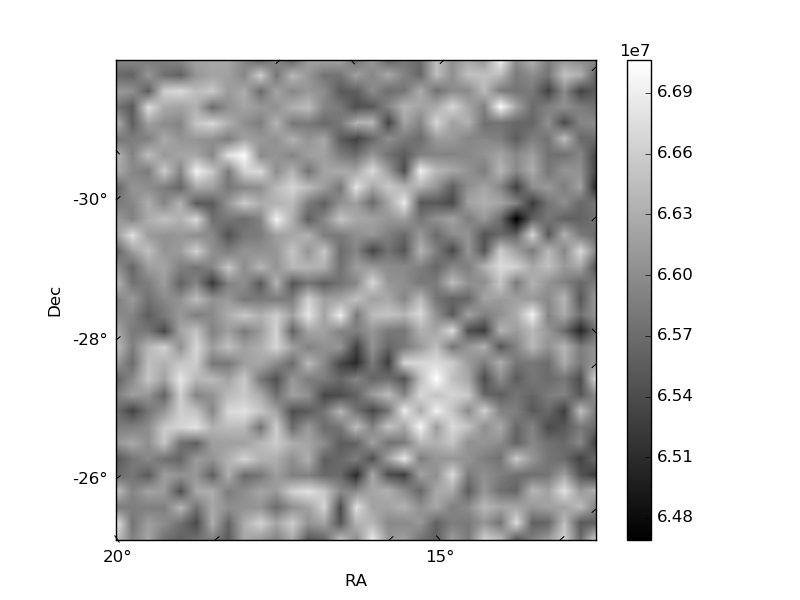
Histogram calculated using DETX and DETY for each event in the final _common_clean file
| Quadrant A |  |
 |
Quadrant B |
|---|---|---|---|
| Quadrant D |  |
 |
Quadrant C |
| Plot type | Count rate plots | Images |
|---|---|---|
| Comparison with Poisson distribution Blue bars denote a histogram of data divided into 1 sec bins. Red curve is a Poisson curve with rate = median count rate of data. |
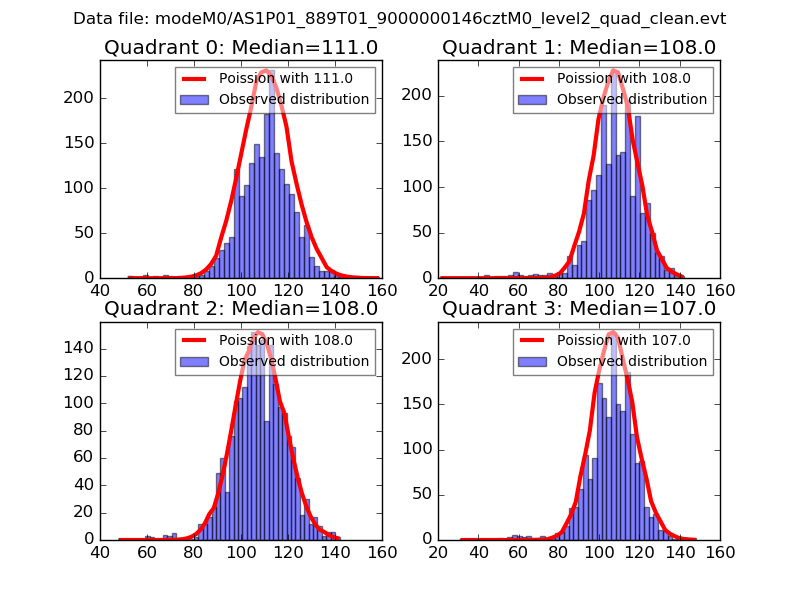 |
 |
| Quadrant-wise count rates Data is divided into 100 sec bins |
 |
|
| Module-wise count rates for Quadrant A Data is divided into 100 sec bins |
 |
 |
| Module-wise count rates for Quadrant B Data is divided into 100 sec bins |
 |
 |
| Module-wise count rates for Quadrant C Data is divided into 100 sec bins |
 |
 |
| Module-wise count rates for Quadrant D Data is divided into 100 sec bins |
 |
 |
| Parameter | Plot |
|---|---|
| CZT HV Monitor |  |
| D_VDD |  |
| Temperature 1 |  |
| Veto HV Monitor |  |
| Veto LLD |  |
| Alpha Counter | 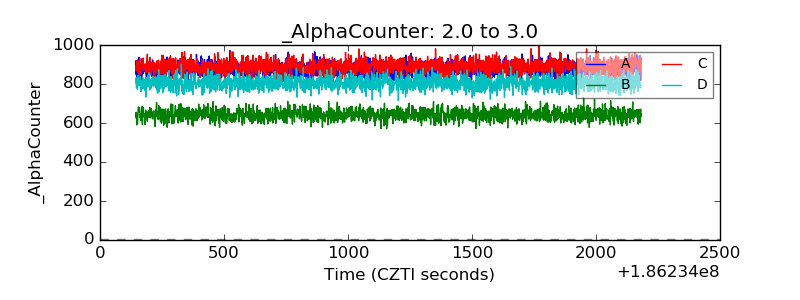 |
| _CPM_Rate |  |
| CZT Counter |  |
| +2.5 Volts monitor | 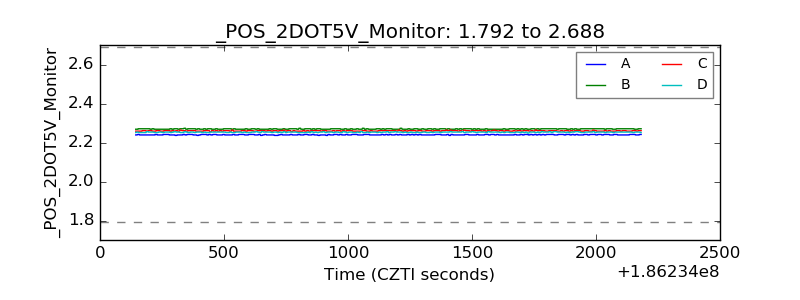 |
| +5 Volts monitor |  |
| _ROLL_ROT | 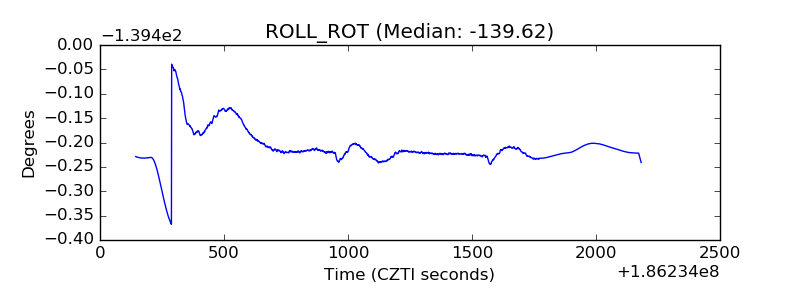 |
| _Roll_DEC |  |
| _Roll_RA |  |
| Veto Counter | 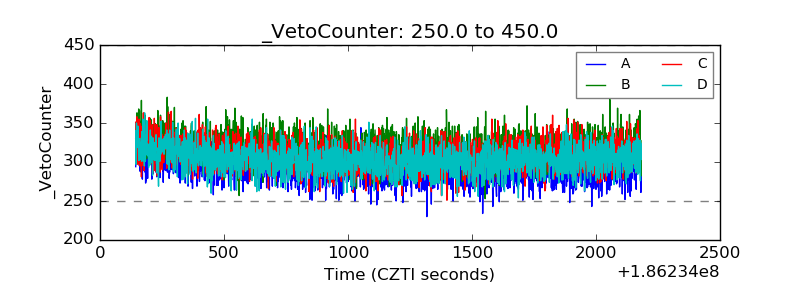 |