| Param | Original file | Final file |
|---|---|---|
| Filename | modeM0/AS1P01_889T01_9000000142cztM0_level2.evt | modeM0/AS1P01_889T01_9000000142cztM0_level2_quad_clean.evt |
| Size (bytes) | 307,739,520 | 15,287,040 |
| Size | 293.5 MB | 14.6 MB |
| Events in quadrant A | 2,081,627 | 79,922 |
| Events in quadrant B | 2,399,096 | 79,306 |
| Events in quadrant C | 2,365,813 | 79,179 |
| Events in quadrant D | 2,334,999 | 75,659 |
| Mode M0 | |||
|---|---|---|---|
| Quadrant | BADHDUFLAG | Total packets | Discarded packets |
| A | 0 | 7635 | 0 |
| B | 0 | 8601 | 0 |
| C | 0 | 8493 | 0 |
| D | 0 | 8412 | 0 |
| Mode SS | |||
|---|---|---|---|
| Quadrant | BADHDUFLAG | Total packets | Discarded packets |
| A | 0 | 40 | 0 |
| B | 0 | 40 | 0 |
| C | 0 | 40 | 0 |
| D | 0 | 40 | 0 |
| Quadrant | Total seconds | Saturated seconds | Saturation percentage |
|---|---|---|---|
| A | 2043 | 0 | 0.000000% |
| B | 2043 | 6 | 0.293686% |
| C | 2043 | 91 | 4.454234% |
| D | 2043 | 34 | 1.664219% |
Noise dominated data is calculated using 1-second bins in cleaned event files. If a bin has >2000 counts, and if more than 50% of those come from <1% of pixels, then it is considered to be noise-dominated and hence unusable.
| Quadrant | # 1 sec bins | Bins with >0 counts | Bins with >2000 counts | High rate bins dominated by noise | Noise dominated (total time) | Noise dominated (detector-on time) | Marked lightcurve |
|---|---|---|---|---|---|---|---|
| A | 2043 | 2043 | 8 | 8 | 0.39% | 0.39% |  |
| B | 2043 | 2043 | 69 | 69 | 3.38% | 3.38% |  |
| C | 2043 | 2043 | 122 | 122 | 5.97% | 5.97% |  |
| D | 2043 | 2043 | 105 | 105 | 5.14% | 5.14% |  |
Top three noisy pixels from each quadrant. If the there are fewer than three noisy pixels in the level2.evt file, extra rows are filled as -1
| Pixel properties | Quadrant properties | ||||||
|---|---|---|---|---|---|---|---|
| Quadrant | DetID | PixID | Counts | Sigma | Mean | Median | Sigma |
| A | 0 | 214 | 6582 | 46.36 | 540 | 544 | 130.2 |
| A | 15 | 127 | 2087 | 11.85 | 540 | 544 | 130.2 |
| A | 14 | 170 | 1990 | 11.1 | 540 | 544 | 130.2 |
| B | 8 | 38 | 151960 | 1142.44 | 569 | 572 | 132.5 |
| B | 0 | 220 | 24491 | 180.5 | 569 | 572 | 132.5 |
| B | 0 | 184 | 20579 | 150.98 | 569 | 572 | 132.5 |
| C | 9 | 83 | 299735 | 2049.24 | 519 | 536 | 146.0 |
| C | 10 | 19 | 11284 | 73.61 | 519 | 536 | 146.0 |
| C | 3 | 79 | 10711 | 69.69 | 519 | 536 | 146.0 |
| D | 7 | 207 | 368827 | 2414.04 | 496 | 512 | 152.6 |
| D | 8 | 144 | 29194 | 187.99 | 496 | 512 | 152.6 |
| D | 10 | 157 | 25964 | 166.82 | 496 | 512 | 152.6 |
Histogram calculated using DETX and DETY for each event in the final _common_clean file
| Quadrant A |  |
 |
Quadrant B |
|---|---|---|---|
| Quadrant D |  |
 |
Quadrant C |
| Plot type | Count rate plots | Images |
|---|---|---|
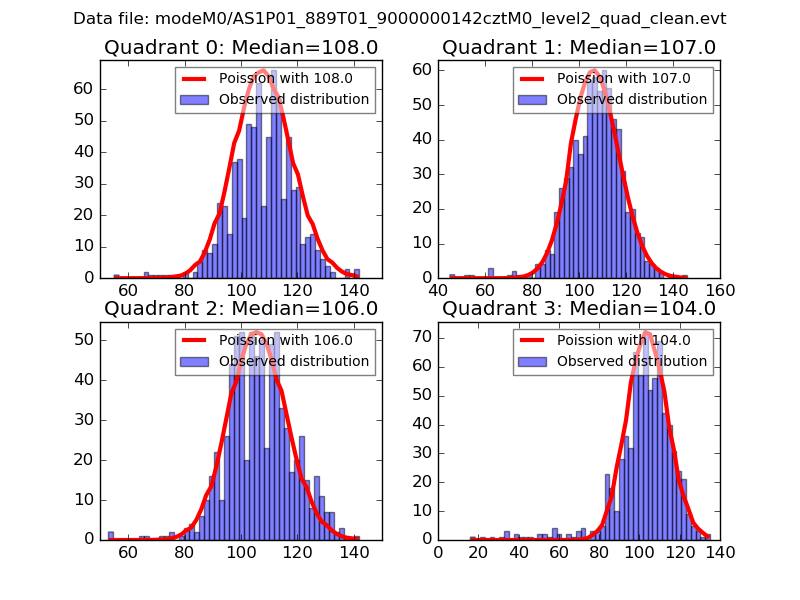
| Comparison with Poisson distribution Blue bars denote a histogram of data divided into 1 sec bins. Red curve is a Poisson curve with rate = median count rate of data. |
 |
 |
| Quadrant-wise count rates Data is divided into 100 sec bins |
 |
|
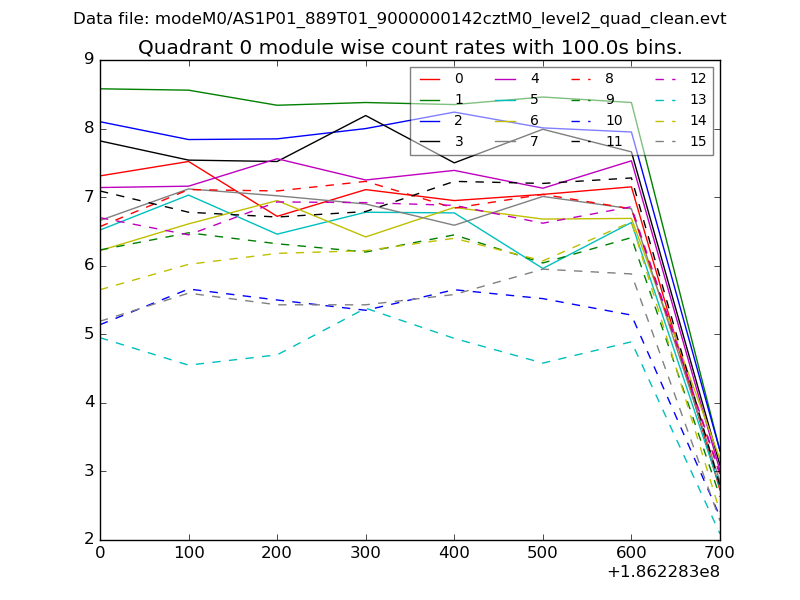
| Module-wise count rates for Quadrant A Data is divided into 100 sec bins |
 |
 |
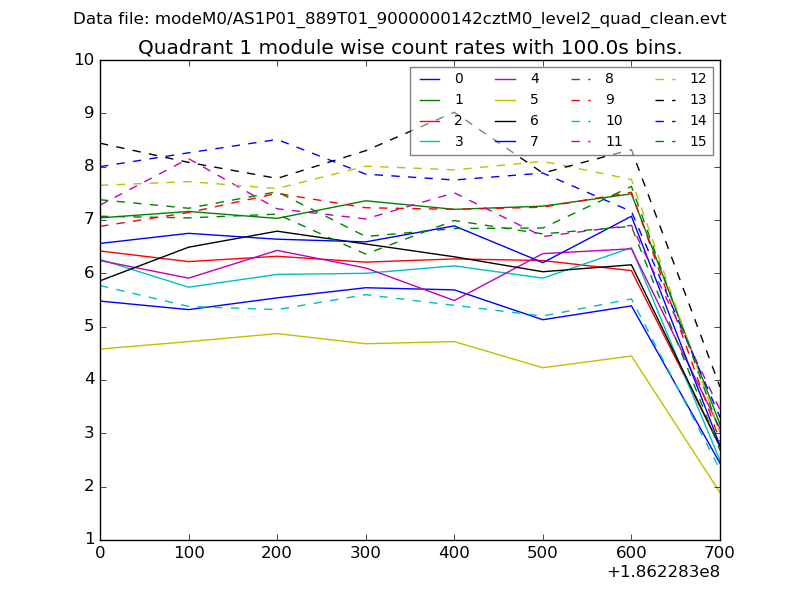
| Module-wise count rates for Quadrant B Data is divided into 100 sec bins |
 |
 |
| Module-wise count rates for Quadrant C Data is divided into 100 sec bins |
 |
 |
| Module-wise count rates for Quadrant D Data is divided into 100 sec bins |
 |
 |
| Parameter | Plot |
|---|---|
| CZT HV Monitor |  |
| D_VDD | 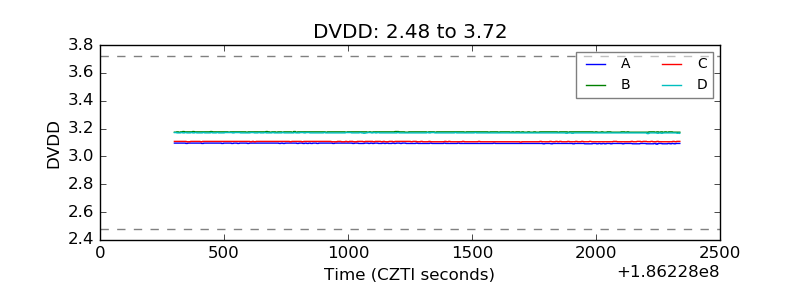 |
| Temperature 1 |  |
| Veto HV Monitor | 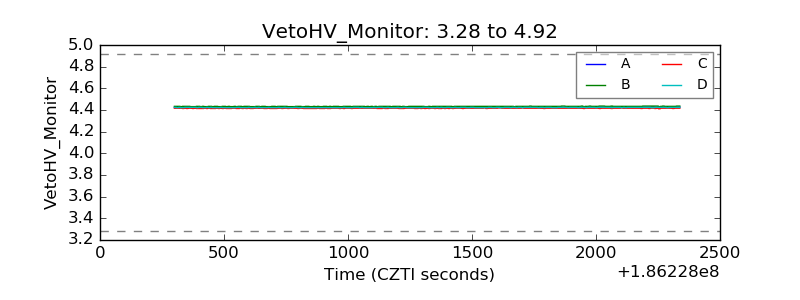 |
| Veto LLD |  |
| Alpha Counter |  |
| _CPM_Rate |  |
| CZT Counter |  |
| +2.5 Volts monitor |  |
| +5 Volts monitor |  |
| _ROLL_ROT |  |
| _Roll_DEC |  |
| _Roll_RA |  |
| Veto Counter | 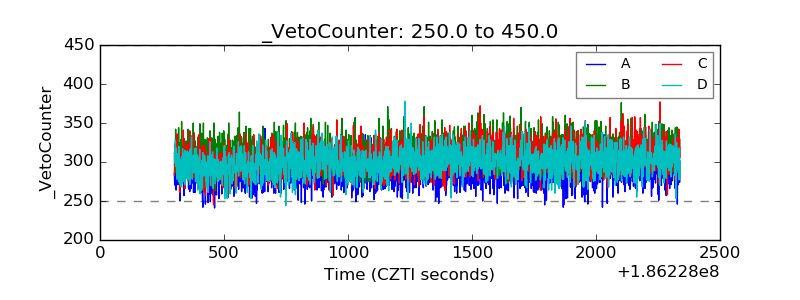 |