| Param | Original file | Final file |
|---|---|---|
| Filename | modeM0/AS1P01_889T01_9000000138cztM0_level2_bc.evt | modeM0/AS1P01_889T01_9000000138cztM0_level2_quad_clean.evt |
| Size (bytes) | 54,895,680 | 30,150,720 |
| Size | 52.4 MB | 28.8 MB |
| Events in quadrant A | 339,941 | 193,551 |
| Events in quadrant B | 403,322 | 192,301 |
| Events in quadrant C | 353,007 | 189,417 |
| Events in quadrant D | 418,342 | 189,026 |
| Mode SS | |||
|---|---|---|---|
| Quadrant | BADHDUFLAG | Total packets | Discarded packets |
| A | 0 | 42 | 0 |
| B | 0 | 42 | 0 |
| C | 0 | 42 | 0 |
| D | 0 | 42 | 0 |
| Mode M0 | |||
|---|---|---|---|
| Quadrant | BADHDUFLAG | Total packets | Discarded packets |
| A | 0 | 7801 | 0 |
| B | 0 | 8235 | 0 |
| C | 0 | 7215 | 0 |
| D | 0 | 7101 | 0 |
| Quadrant | Total seconds | Saturated seconds | Saturation percentage |
|---|---|---|---|
| A | 2041 | 0 | 0.000000% |
| B | 2041 | 1 | 0.048996% |
| C | 2041 | 0 | 0.000000% |
| D | 2041 | 2 | 0.097991% |
Noise dominated data is calculated using 1-second bins in cleaned event files. If a bin has >2000 counts, and if more than 50% of those come from <1% of pixels, then it is considered to be noise-dominated and hence unusable.
| Quadrant | # 1 sec bins | Bins with >0 counts | Bins with >2000 counts | High rate bins dominated by noise | Noise dominated (total time) | Noise dominated (detector-on time) | Marked lightcurve |
|---|---|---|---|---|---|---|---|
| A | 2041 | 2041 | 0 | 0 | 0.00% | 0.00% |  |
| B | 2041 | 2041 | 0 | 0 | 0.00% | 0.00% |  |
| C | 2041 | 2041 | 0 | 0 | 0.00% | 0.00% |  |
| D | 2041 | 2041 | 1 | 1 | 0.05% | 0.05% |  |
Top three noisy pixels from each quadrant. If the there are fewer than three noisy pixels in the level2.evt file, extra rows are filled as -1
| Pixel properties | Quadrant properties | ||||||
|---|---|---|---|---|---|---|---|
| Quadrant | DetID | PixID | Counts | Sigma | Mean | Median | Sigma |
| A | 0 | 117 | 8600 | 417.2 | 84 | 83 | 20.4 |
| A | 10 | 133 | 4534 | 218.03 | 84 | 83 | 20.4 |
| A | 14 | 170 | 421 | 16.56 | 84 | 83 | 20.4 |
| B | 0 | 220 | 41392 | 2253.52 | 86 | 83 | 18.3 |
| B | 5 | 200 | 3831 | 204.46 | 86 | 83 | 18.3 |
| B | 8 | 38 | 3627 | 193.33 | 86 | 83 | 18.3 |
| C | 3 | 79 | 8389 | 420.89 | 82 | 80 | 19.7 |
| C | 3 | 111 | 6375 | 318.87 | 82 | 80 | 19.7 |
| C | 8 | 208 | 5269 | 262.85 | 82 | 80 | 19.7 |
| D | 1 | 4 | 22171 | 1048.26 | 82 | 79 | 21.1 |
| D | 8 | 144 | 15102 | 712.84 | 82 | 79 | 21.1 |
| D | 2 | 16 | 13461 | 634.98 | 82 | 79 | 21.1 |
Histogram calculated using DETX and DETY for each event in the final _common_clean file
| Quadrant A |  |
 |
Quadrant B |
|---|---|---|---|
| Quadrant D |  |
 |
Quadrant C |
| Plot type | Count rate plots | Images |
|---|---|---|
| Comparison with Poisson distribution Blue bars denote a histogram of data divided into 1 sec bins. Red curve is a Poisson curve with rate = median count rate of data. |
 |
 |
| Quadrant-wise count rates Data is divided into 100 sec bins |
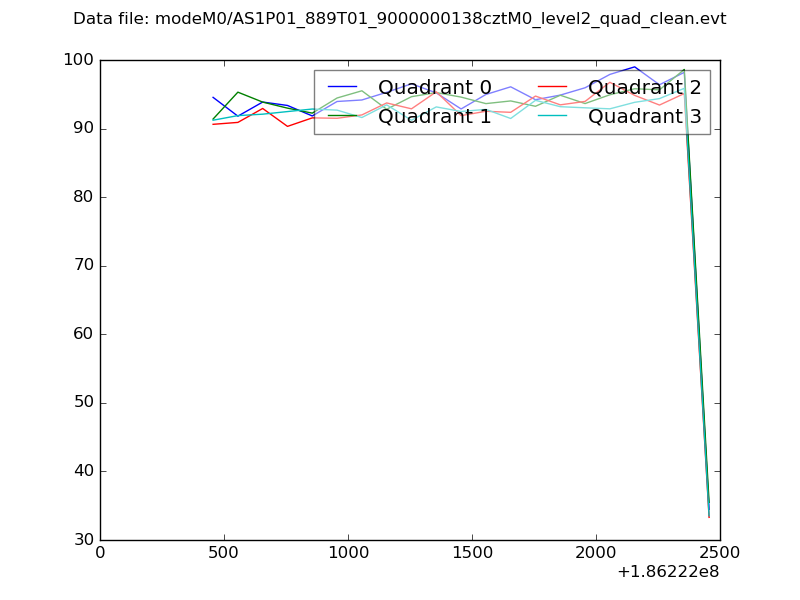 |
|
| Module-wise count rates for Quadrant A Data is divided into 100 sec bins |
 |
 |
| Module-wise count rates for Quadrant B Data is divided into 100 sec bins |
 |
 |
| Module-wise count rates for Quadrant C Data is divided into 100 sec bins |
 |
 |
| Module-wise count rates for Quadrant D Data is divided into 100 sec bins |
 |
 |
| Parameter | Plot |
|---|---|
| CZT HV Monitor | 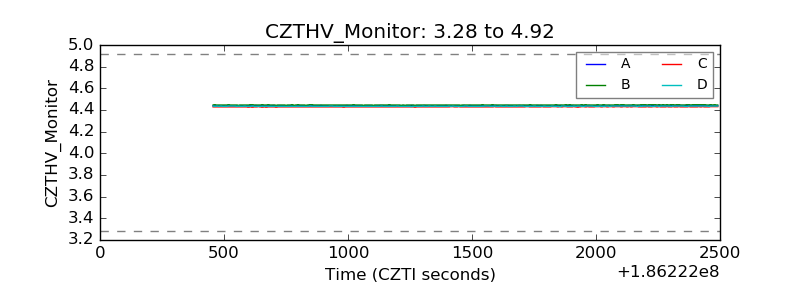 |
| D_VDD |  |
| Temperature 1 |  |
| Veto HV Monitor |  |
| Veto LLD |  |
| Alpha Counter |  |
| _CPM_Rate |  |
| CZT Counter |  |
| +2.5 Volts monitor |  |
| +5 Volts monitor | 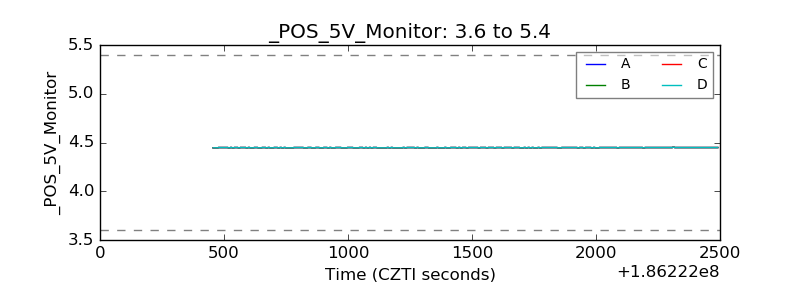 |
| _ROLL_ROT | 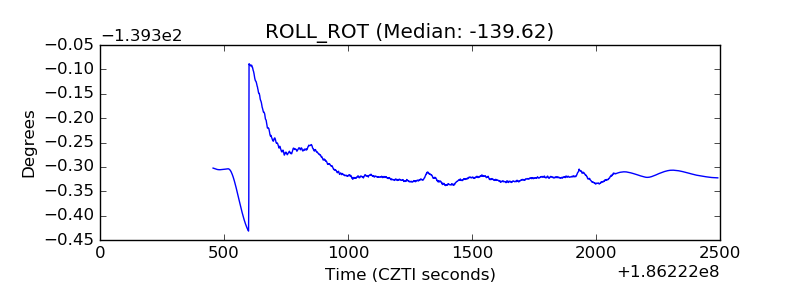 |
| _Roll_DEC |  |
| _Roll_RA |  |
| Veto Counter | 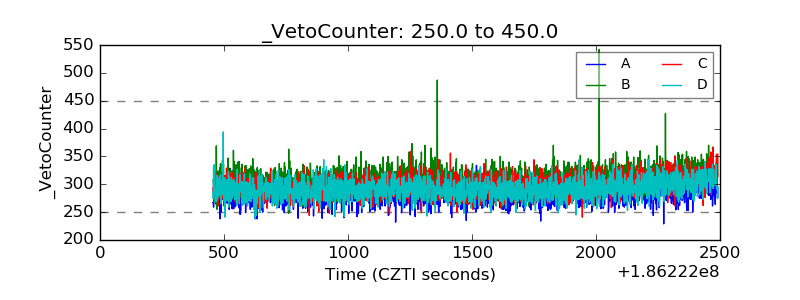 |