| Param | Original file | Final file |
|---|---|---|
| Filename | modeM0/AS1P01_889T01_9000000134cztM0_level2_bc.evt | modeM0/AS1P01_889T01_9000000134cztM0_level2_quad_clean.evt |
| Size (bytes) | 66,683,520 | 30,602,880 |
| Size | 63.6 MB | 29.2 MB |
| Events in quadrant A | 335,795 | 197,275 |
| Events in quadrant B | 685,886 | 193,731 |
| Events in quadrant C | 407,599 | 194,853 |
| Events in quadrant D | 442,883 | 192,499 |
| Mode SS | |||
|---|---|---|---|
| Quadrant | BADHDUFLAG | Total packets | Discarded packets |
| A | 0 | 40 | 0 |
| B | 0 | 40 | 0 |
| C | 0 | 40 | 0 |
| D | 0 | 40 | 0 |
| Mode M0 | |||
|---|---|---|---|
| Quadrant | BADHDUFLAG | Total packets | Discarded packets |
| A | 0 | 8052 | 0 |
| B | 0 | 9424 | 0 |
| C | 0 | 7698 | 0 |
| D | 0 | 7390 | 0 |
| Quadrant | Total seconds | Saturated seconds | Saturation percentage |
|---|---|---|---|
| A | 2042 | 0 | 0.000000% |
| B | 2042 | 33 | 1.616063% |
| C | 2042 | 0 | 0.000000% |
| D | 2042 | 0 | 0.000000% |
Noise dominated data is calculated using 1-second bins in cleaned event files. If a bin has >2000 counts, and if more than 50% of those come from <1% of pixels, then it is considered to be noise-dominated and hence unusable.
| Quadrant | # 1 sec bins | Bins with >0 counts | Bins with >2000 counts | High rate bins dominated by noise | Noise dominated (total time) | Noise dominated (detector-on time) | Marked lightcurve |
|---|---|---|---|---|---|---|---|
| A | 2042 | 2042 | 0 | 0 | 0.00% | 0.00% |  |
| B | 2041 | 2041 | 15 | 15 | 0.73% | 0.73% |  |
| C | 2042 | 2042 | 0 | 0 | 0.00% | 0.00% |  |
| D | 2042 | 2042 | 0 | 0 | 0.00% | 0.00% |  |
Top three noisy pixels from each quadrant. If the there are fewer than three noisy pixels in the level2.evt file, extra rows are filled as -1
| Pixel properties | Quadrant properties | ||||||
|---|---|---|---|---|---|---|---|
| Quadrant | DetID | PixID | Counts | Sigma | Mean | Median | Sigma |
| A | 10 | 133 | 1076 | 47.51 | 86 | 85 | 20.9 |
| A | 15 | 17 | 646 | 26.9 | 86 | 85 | 20.9 |
| A | 14 | 79 | 315 | 11.03 | 86 | 85 | 20.9 |
| B | 8 | 38 | 299657 | 16421.58 | 87 | 85 | 18.2 |
| B | 0 | 220 | 36928 | 2019.62 | 87 | 85 | 18.2 |
| B | 7 | 221 | 2798 | 148.72 | 87 | 85 | 18.2 |
| C | 1 | 192 | 51858 | 2554.8 | 85 | 83 | 20.3 |
| C | 3 | 79 | 8967 | 438.37 | 85 | 83 | 20.3 |
| C | 3 | 111 | 6651 | 324.09 | 85 | 83 | 20.3 |
| D | 1 | 4 | 56823 | 2687.45 | 85 | 82 | 21.1 |
| D | 13 | 169 | 30730 | 1451.59 | 85 | 82 | 21.1 |
| D | 13 | 170 | 4993 | 232.6 | 85 | 82 | 21.1 |
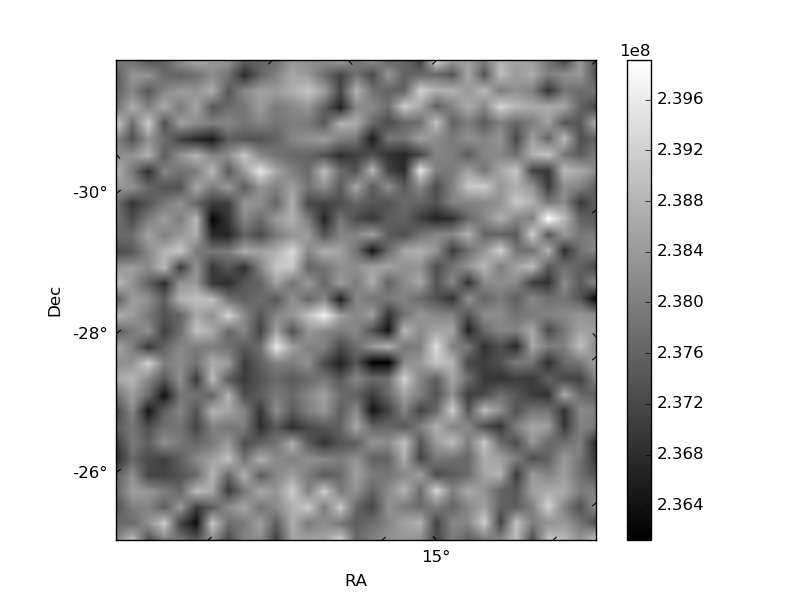
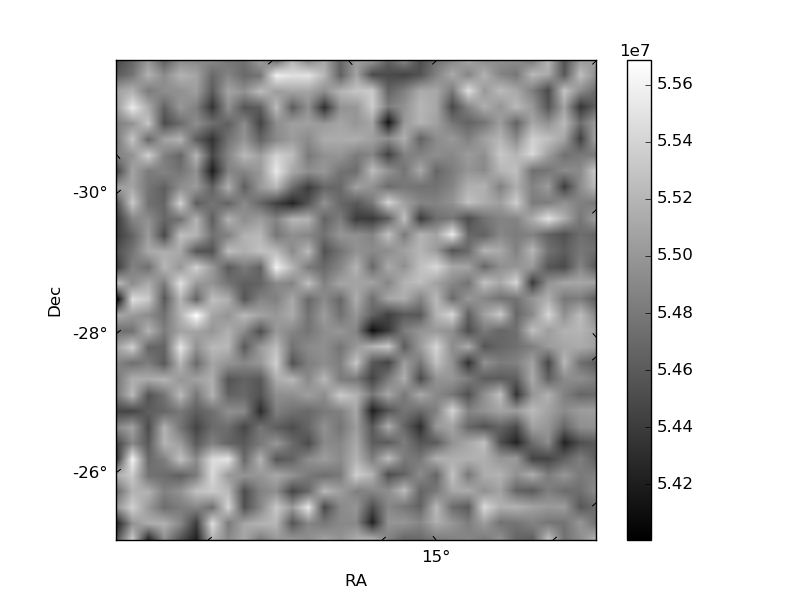
Histogram calculated using DETX and DETY for each event in the final _common_clean file
| Quadrant A |  |
 |
Quadrant B |
|---|---|---|---|
| Quadrant D |  |
 |
Quadrant C |
| Plot type | Count rate plots | Images |
|---|---|---|
| Comparison with Poisson distribution Blue bars denote a histogram of data divided into 1 sec bins. Red curve is a Poisson curve with rate = median count rate of data. |
 |
 |
| Quadrant-wise count rates Data is divided into 100 sec bins |
 |
|
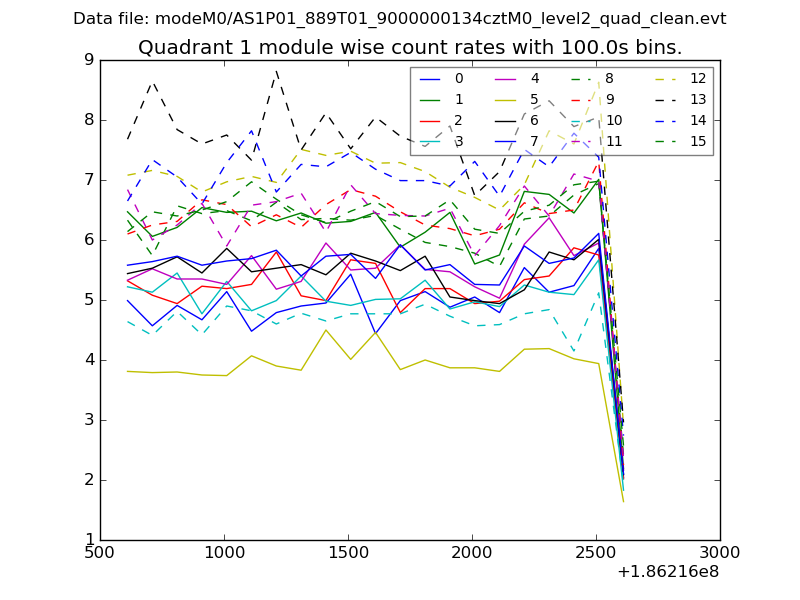
| Module-wise count rates for Quadrant A Data is divided into 100 sec bins |
 |
 |
| Module-wise count rates for Quadrant B Data is divided into 100 sec bins |
 |
 |
| Module-wise count rates for Quadrant C Data is divided into 100 sec bins |
 |
 |
| Module-wise count rates for Quadrant D Data is divided into 100 sec bins |
 |
 |
| Parameter | Plot |
|---|---|
| CZT HV Monitor |  |
| D_VDD |  |
| Temperature 1 |  |
| Veto HV Monitor |  |
| Veto LLD |  |
| Alpha Counter |  |
| _CPM_Rate |  |
| CZT Counter |  |
| +2.5 Volts monitor |  |
| +5 Volts monitor |  |
| _ROLL_ROT |  |
| _Roll_DEC |  |
| _Roll_RA |  |
| Veto Counter | 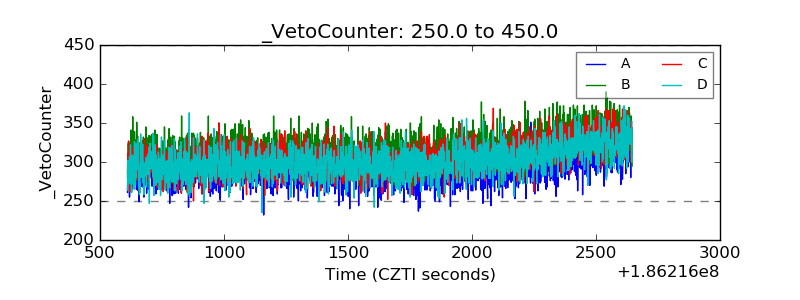 |