| Param | Original file | Final file |
|---|---|---|
| Filename | modeM0/AS1P01_889T01_9000000130cztM0_level2_bc.evt | modeM0/AS1P01_889T01_9000000130cztM0_level2_quad_clean.evt |
| Size (bytes) | 141,860,160 | 28,396,800 |
| Size | 135.3 MB | 27.1 MB |
| Events in quadrant A | 343,778 | 201,334 |
| Events in quadrant B | 375,219 | 199,654 |
| Events in quadrant C | 2,996,182 | 114,774 |
| Events in quadrant D | 433,852 | 195,216 |
| Mode M0 | |||
|---|---|---|---|
| Quadrant | BADHDUFLAG | Total packets | Discarded packets |
| A | 0 | 8183 | 0 |
| B | 0 | 8568 | 0 |
| C | 0 | 16614 | 0 |
| D | 0 | 7607 | 0 |
| Mode SS | |||
|---|---|---|---|
| Quadrant | BADHDUFLAG | Total packets | Discarded packets |
| A | 0 | 40 | 0 |
| B | 0 | 40 | 0 |
| C | 0 | 40 | 0 |
| D | 0 | 40 | 0 |
| Quadrant | Total seconds | Saturated seconds | Saturation percentage |
|---|---|---|---|
| A | 2041 | 0 | 0.000000% |
| B | 2041 | 2 | 0.097991% |
| C | 2041 | 1345 | 65.899069% |
| D | 2041 | 2 | 0.097991% |
Noise dominated data is calculated using 1-second bins in cleaned event files. If a bin has >2000 counts, and if more than 50% of those come from <1% of pixels, then it is considered to be noise-dominated and hence unusable.
| Quadrant | # 1 sec bins | Bins with >0 counts | Bins with >2000 counts | High rate bins dominated by noise | Noise dominated (total time) | Noise dominated (detector-on time) | Marked lightcurve |
|---|---|---|---|---|---|---|---|
| A | 2041 | 2041 | 0 | 0 | 0.00% | 0.00% |  |
| B | 2041 | 2041 | 0 | 0 | 0.00% | 0.00% |  |
| C | 2041 | 2041 | 798 | 798 | 39.10% | 39.10% |  |
| D | 2041 | 2041 | 1 | 1 | 0.05% | 0.05% |  |
Top three noisy pixels from each quadrant. If the there are fewer than three noisy pixels in the level2.evt file, extra rows are filled as -1
| Pixel properties | Quadrant properties | ||||||
|---|---|---|---|---|---|---|---|
| Quadrant | DetID | PixID | Counts | Sigma | Mean | Median | Sigma |
| A | 10 | 133 | 2482 | 111.51 | 88 | 86 | 21.5 |
| A | 12 | 243 | 228 | 6.61 | 88 | 86 | 21.5 |
| A | 10 | 83 | 224 | 6.42 | 88 | 86 | 21.5 |
| B | 0 | 245 | 7888 | 414.92 | 89 | 87 | 18.8 |
| B | 5 | 249 | 4965 | 259.45 | 89 | 87 | 18.8 |
| B | 7 | 221 | 4303 | 224.24 | 89 | 87 | 18.8 |
| C | 9 | 83 | 2742935 | 198211.22 | 53 | 52 | 13.8 |
| C | 1 | 192 | 29728 | 2144.5 | 53 | 52 | 13.8 |
| C | 3 | 79 | 4419 | 315.58 | 53 | 52 | 13.8 |
| D | 1 | 4 | 59695 | 2763.23 | 87 | 84 | 21.6 |
| D | 2 | 16 | 9326 | 428.41 | 87 | 84 | 21.6 |
| D | 2 | 63 | 6350 | 290.46 | 87 | 84 | 21.6 |
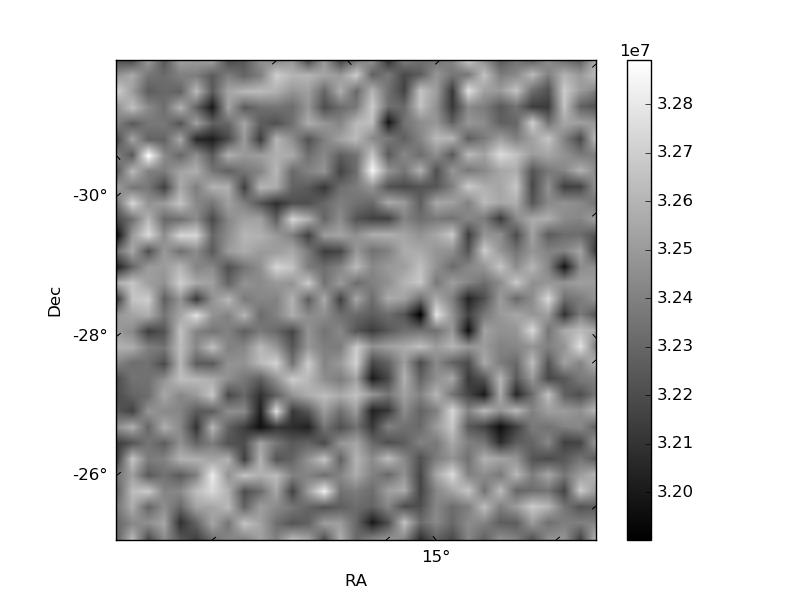
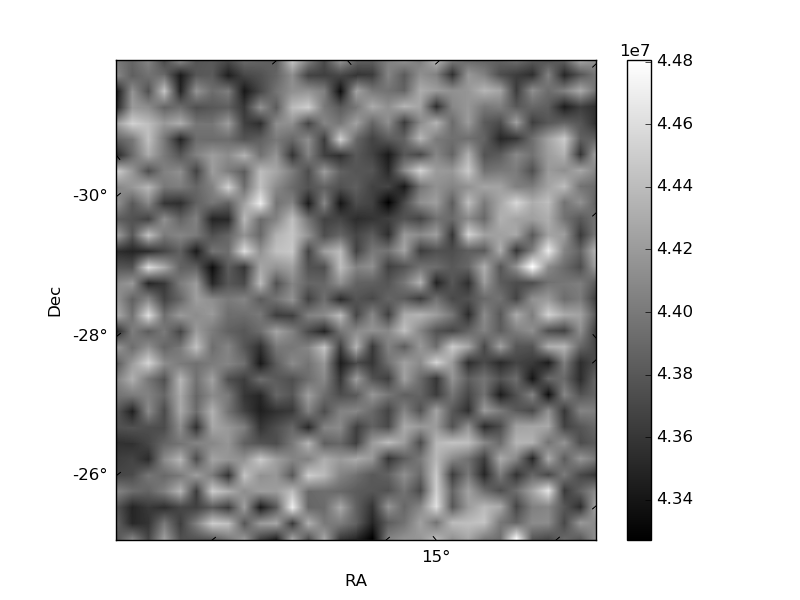
Histogram calculated using DETX and DETY for each event in the final _common_clean file
| Quadrant A |  |
 |
Quadrant B |
|---|---|---|---|
| Quadrant D |  |
 |
Quadrant C |
| Plot type | Count rate plots | Images |
|---|---|---|
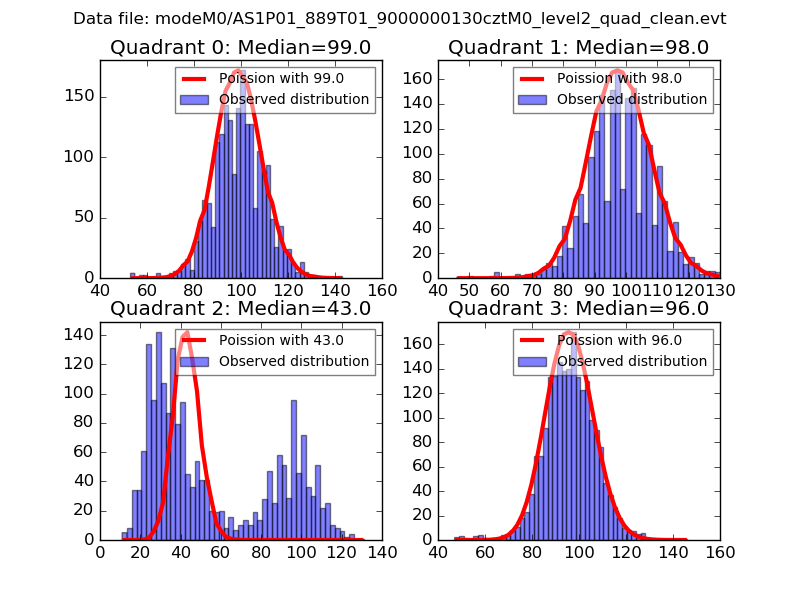
| Comparison with Poisson distribution Blue bars denote a histogram of data divided into 1 sec bins. Red curve is a Poisson curve with rate = median count rate of data. |
 |
 |
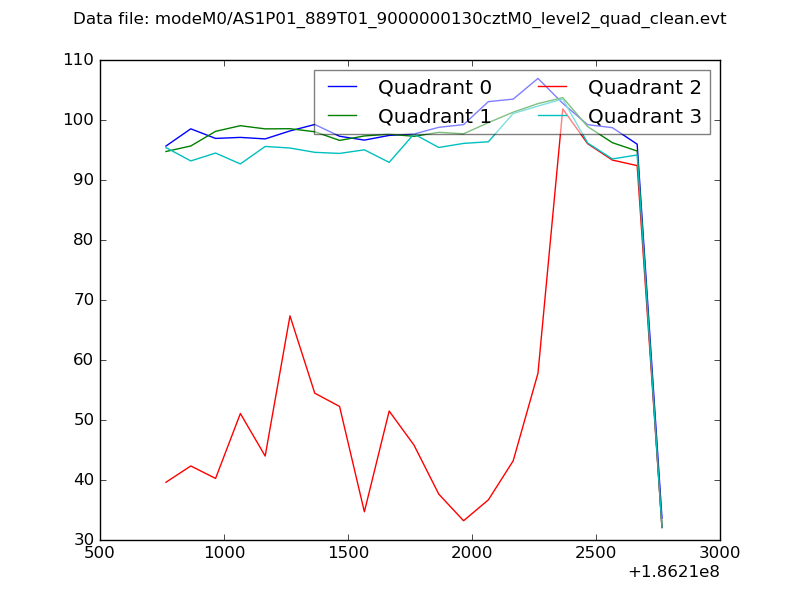
| Quadrant-wise count rates Data is divided into 100 sec bins |
 |
|
| Module-wise count rates for Quadrant A Data is divided into 100 sec bins |
 |
 |
| Module-wise count rates for Quadrant B Data is divided into 100 sec bins |
 |
 |
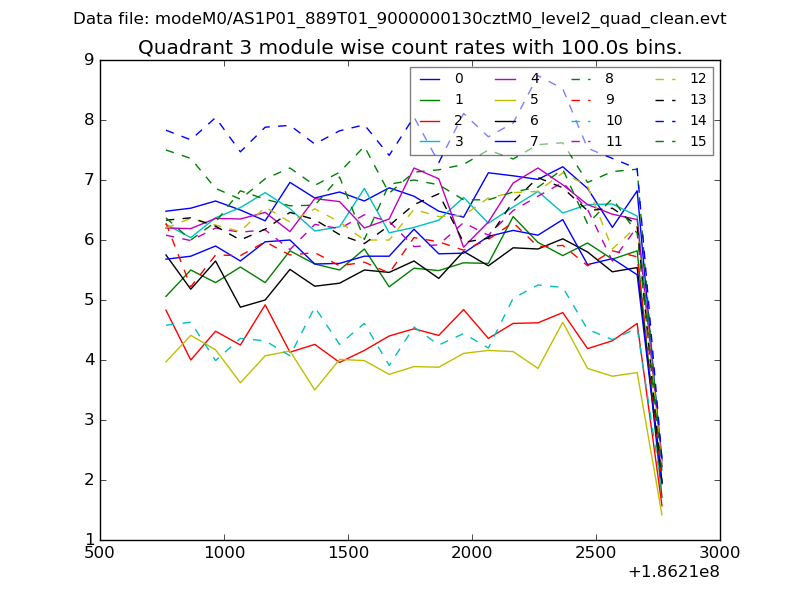
| Module-wise count rates for Quadrant C Data is divided into 100 sec bins |
 |
 |
| Module-wise count rates for Quadrant D Data is divided into 100 sec bins |
 |
 |
| Parameter | Plot |
|---|---|
| CZT HV Monitor |  |
| D_VDD |  |
| Temperature 1 |  |
| Veto HV Monitor |  |
| Veto LLD |  |
| Alpha Counter |  |
| _CPM_Rate |  |
| CZT Counter |  |
| +2.5 Volts monitor |  |
| +5 Volts monitor |  |
| _ROLL_ROT |  |
| _Roll_DEC |  |
| _Roll_RA |  |
| Veto Counter |  |