| Param | Original file | Final file |
|---|---|---|
| Filename | modeM0/AS1P01_171T01_9000000126cztM0_level2.evt | modeM0/AS1P01_171T01_9000000126cztM0_level2_quad_clean.evt |
| Size (bytes) | 5,048,654,400 | 391,161,600 |
| Size | 4.7 GB | 373.0 MB |
| Events in quadrant A | 37,151,920 | 2,450,690 |
| Events in quadrant B | 40,332,060 | 2,487,249 |
| Events in quadrant C | 37,172,812 | 2,430,144 |
| Events in quadrant D | 36,203,554 | 2,351,978 |
| Mode M0 | |||
|---|---|---|---|
| Quadrant | BADHDUFLAG | Total packets | Discarded packets |
| A | 0 | 132355 | 0 |
| B | 0 | 141827 | 0 |
| C | 0 | 132400 | 0 |
| D | 0 | 129586 | 0 |
| Mode SS | |||
|---|---|---|---|
| Quadrant | BADHDUFLAG | Total packets | Discarded packets |
| A | 0 | 626 | 0 |
| B | 0 | 626 | 0 |
| C | 0 | 626 | 0 |
| D | 0 | 626 | 0 |
| Mode M9 | |||
|---|---|---|---|
| Quadrant | BADHDUFLAG | Total packets | Discarded packets |
| A | 0 | 30 | 0 |
| B | 0 | 30 | 0 |
| C | 0 | 30 | 0 |
| D | 0 | 30 | 0 |
| Quadrant | Total seconds | Saturated seconds | Saturation percentage |
|---|---|---|---|
| A | 30962 | 75 | 0.242232% |
| B | 30962 | 433 | 1.398488% |
| C | 30962 | 52 | 0.167948% |
| D | 30962 | 416 | 1.343582% |
Noise dominated data is calculated using 1-second bins in cleaned event files. If a bin has >2000 counts, and if more than 50% of those come from <1% of pixels, then it is considered to be noise-dominated and hence unusable.
| Quadrant | # 1 sec bins | Bins with >0 counts | Bins with >2000 counts | High rate bins dominated by noise | Noise dominated (total time) | Noise dominated (detector-on time) | Marked lightcurve |
|---|---|---|---|---|---|---|---|
| A | 33923 | 30964 | 1309 | 1309 | 3.86% | 4.23% | 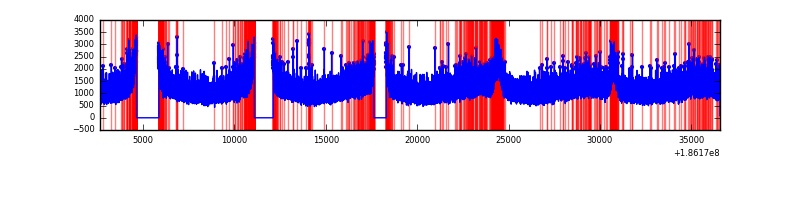 |
| B | 33923 | 30965 | 2376 | 2376 | 7.00% | 7.67% |  |
| C | 33923 | 30966 | 1309 | 1309 | 3.86% | 4.23% | 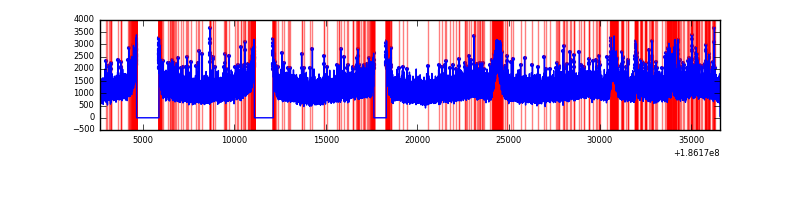 |
| D | 33923 | 30966 | 1479 | 1479 | 4.36% | 4.78% |  |
Top three noisy pixels from each quadrant. If the there are fewer than three noisy pixels in the level2.evt file, extra rows are filled as -1
| Pixel properties | Quadrant properties | ||||||
|---|---|---|---|---|---|---|---|
| Quadrant | DetID | PixID | Counts | Sigma | Mean | Median | Sigma |
| A | 12 | 133 | 73741 | 27.5 | 9662 | 9731 | 2328.0 |
| A | 11 | 79 | 41015 | 13.44 | 9662 | 9731 | 2328.0 |
| A | 3 | 111 | 30281 | 8.83 | 9662 | 9731 | 2328.0 |
| B | 7 | 221 | 1088676 | 459.18 | 10051 | 10109 | 2348.9 |
| B | 0 | 184 | 364525 | 150.89 | 10051 | 10109 | 2348.9 |
| B | 0 | 220 | 341867 | 141.24 | 10051 | 10109 | 2348.9 |
| C | 1 | 192 | 860715 | 330.53 | 9217 | 9561 | 2575.1 |
| C | 3 | 111 | 123608 | 44.29 | 9217 | 9561 | 2575.1 |
| C | 3 | 79 | 76684 | 26.07 | 9217 | 9561 | 2575.1 |
| D | 12 | 22 | 1082430 | 391.49 | 8880 | 9217 | 2741.4 |
| D | 1 | 4 | 733242 | 264.11 | 8880 | 9217 | 2741.4 |
| D | 13 | 169 | 556678 | 199.7 | 8880 | 9217 | 2741.4 |
Histogram calculated using DETX and DETY for each event in the final _common_clean file
| Quadrant A |  |
 |
Quadrant B |
|---|---|---|---|
| Quadrant D |  |
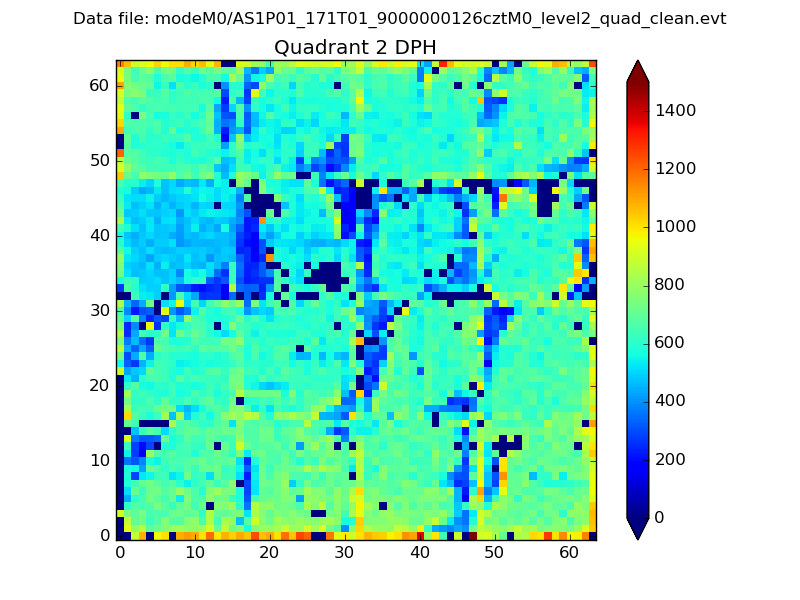 |
Quadrant C |
| Plot type | Count rate plots | Images |
|---|---|---|
| Comparison with Poisson distribution Blue bars denote a histogram of data divided into 1 sec bins. Red curve is a Poisson curve with rate = median count rate of data. |
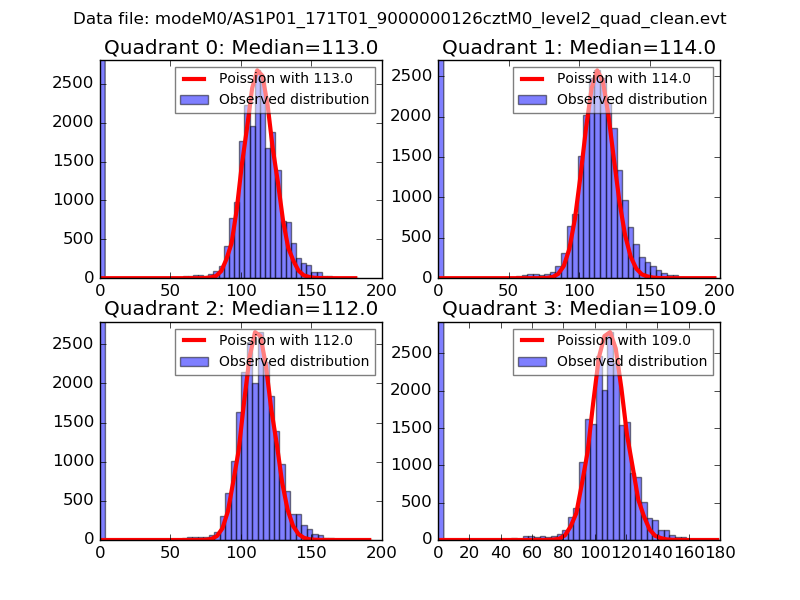 |
 |
| Quadrant-wise count rates Data is divided into 100 sec bins |
 |
|
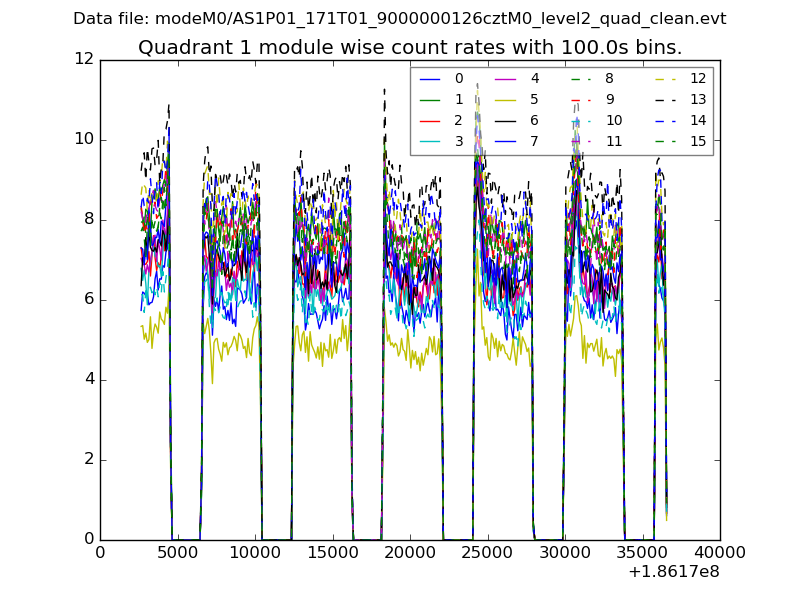
| Module-wise count rates for Quadrant A Data is divided into 100 sec bins |
 |
 |
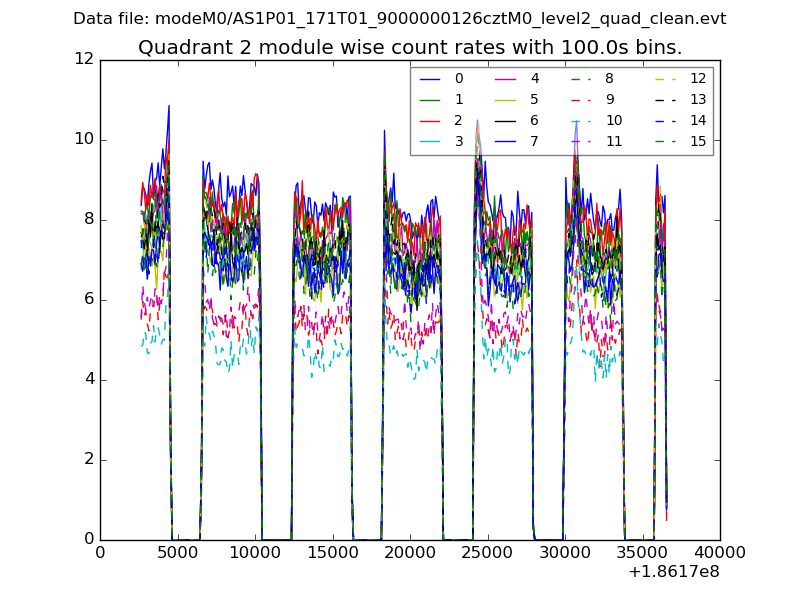
| Module-wise count rates for Quadrant B Data is divided into 100 sec bins |
 |
 |
| Module-wise count rates for Quadrant C Data is divided into 100 sec bins |
 |
 |
| Module-wise count rates for Quadrant D Data is divided into 100 sec bins |
 |
 |
| Parameter | Plot |
|---|---|
| CZT HV Monitor |  |
| D_VDD | 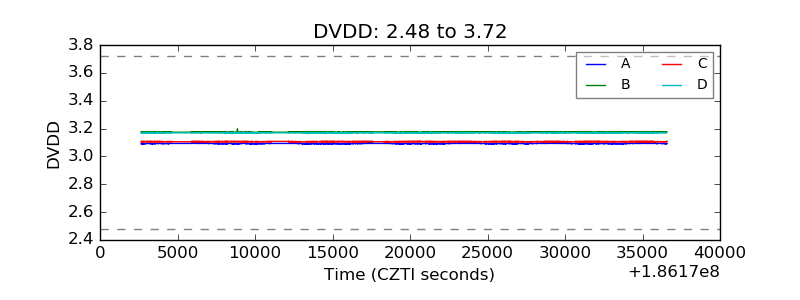 |
| Temperature 1 |  |
| Veto HV Monitor | 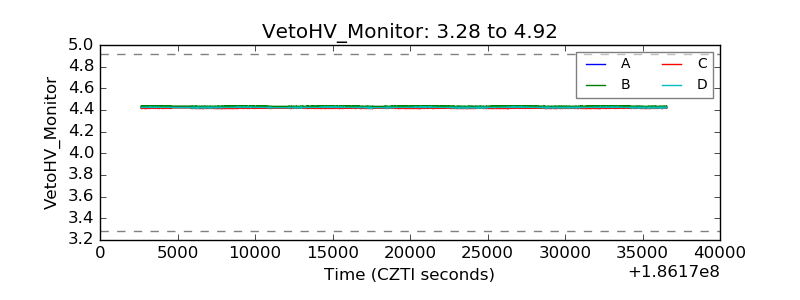 |
| Veto LLD | 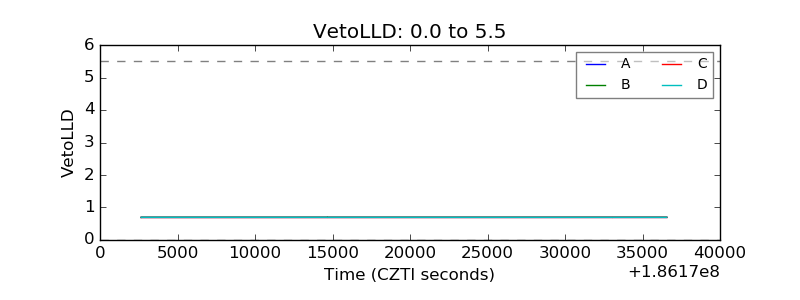 |
| Alpha Counter |  |
| _CPM_Rate |  |
| CZT Counter |  |
| +2.5 Volts monitor |  |
| +5 Volts monitor | 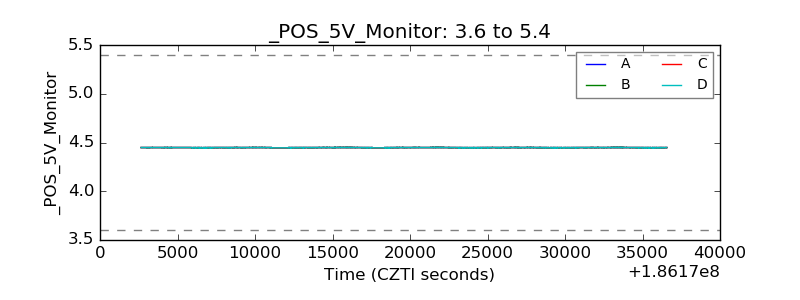 |
| _ROLL_ROT |  |
| _Roll_DEC |  |
| _Roll_RA |  |
| Veto Counter |  |