| Param | Original file | Final file |
|---|---|---|
| Filename | modeM0/AS1P01_161T02_9000000124cztM0_level2_bc.evt | modeM0/AS1P01_161T02_9000000124cztM0_level2_quad_clean.evt |
| Size (bytes) | 708,321,600 | 286,309,440 |
| Size | 675.5 MB | 273.0 MB |
| Events in quadrant A | 4,163,147 | 1,818,821 |
| Events in quadrant B | 4,796,466 | 1,810,124 |
| Events in quadrant C | 4,374,019 | 1,777,855 |
| Events in quadrant D | 6,572,006 | 1,710,302 |
| Mode M9 | |||
|---|---|---|---|
| Quadrant | BADHDUFLAG | Total packets | Discarded packets |
| A | 0 | 58 | 0 |
| B | 0 | 58 | 0 |
| C | 0 | 58 | 0 |
| D | 0 | 58 | 0 |
| Mode M0 | |||
|---|---|---|---|
| Quadrant | BADHDUFLAG | Total packets | Discarded packets |
| A | 0 | 95043 | 0 |
| B | 0 | 99670 | 0 |
| C | 0 | 93987 | 0 |
| D | 0 | 97164 | 0 |
| Mode SS | |||
|---|---|---|---|
| Quadrant | BADHDUFLAG | Total packets | Discarded packets |
| A | 0 | 462 | 0 |
| B | 0 | 462 | 0 |
| C | 0 | 462 | 0 |
| D | 0 | 462 | 0 |
| Quadrant | Total seconds | Saturated seconds | Saturation percentage |
|---|---|---|---|
| A | 22587 | 94 | 0.416169% |
| B | 22587 | 83 | 0.367468% |
| C | 22587 | 68 | 0.301058% |
| D | 22587 | 484 | 2.142826% |
Noise dominated data is calculated using 1-second bins in cleaned event files. If a bin has >2000 counts, and if more than 50% of those come from <1% of pixels, then it is considered to be noise-dominated and hence unusable.
| Quadrant | # 1 sec bins | Bins with >0 counts | Bins with >2000 counts | High rate bins dominated by noise | Noise dominated (total time) | Noise dominated (detector-on time) | Marked lightcurve |
|---|---|---|---|---|---|---|---|
| A | 28407 | 22584 | 0 | 0 | 0.00% | 0.00% | 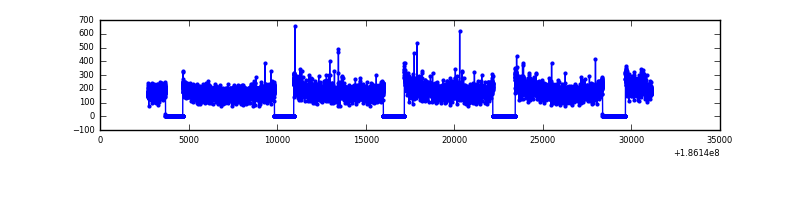 |
| B | 28407 | 22584 | 0 | 0 | 0.00% | 0.00% |  |
| C | 28407 | 22584 | 0 | 0 | 0.00% | 0.00% |  |
| D | 28407 | 22582 | 61 | 61 | 0.21% | 0.27% |  |
Top three noisy pixels from each quadrant. If the there are fewer than three noisy pixels in the level2.evt file, extra rows are filled as -1
| Pixel properties | Quadrant properties | ||||||
|---|---|---|---|---|---|---|---|
| Quadrant | DetID | PixID | Counts | Sigma | Mean | Median | Sigma |
| A | 15 | 233 | 14241 | 60.18 | 1064 | 1039 | 219.4 |
| A | 12 | 189 | 13636 | 57.42 | 1064 | 1039 | 219.4 |
| A | 0 | 253 | 12394 | 51.76 | 1064 | 1039 | 219.4 |
| B | 0 | 220 | 304538 | 1621.48 | 1078 | 1047 | 187.2 |
| B | 15 | 255 | 61314 | 321.99 | 1078 | 1047 | 187.2 |
| B | 15 | 22 | 49827 | 260.62 | 1078 | 1047 | 187.2 |
| C | 3 | 79 | 64421 | 294.58 | 1045 | 1028 | 215.2 |
| C | 3 | 111 | 54066 | 246.46 | 1045 | 1028 | 215.2 |
| C | 15 | 241 | 39587 | 179.18 | 1045 | 1028 | 215.2 |
| D | 12 | 22 | 1296204 | 5863.89 | 1034 | 1004 | 220.9 |
| D | 10 | 102 | 350884 | 1584.05 | 1034 | 1004 | 220.9 |
| D | 13 | 169 | 328598 | 1483.15 | 1034 | 1004 | 220.9 |
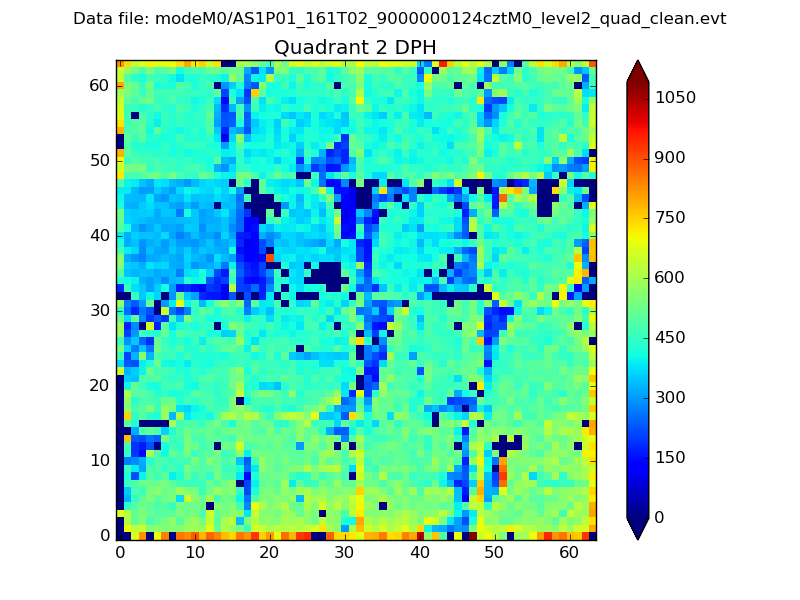
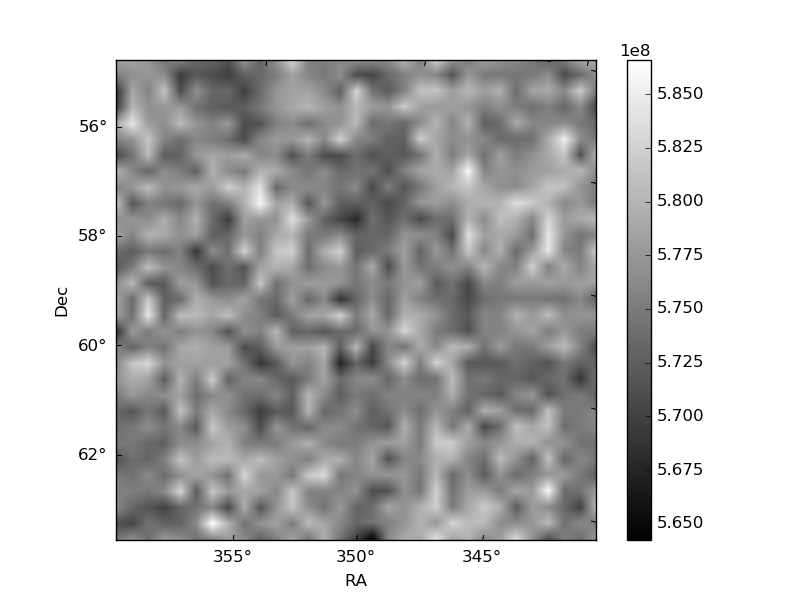
Histogram calculated using DETX and DETY for each event in the final _common_clean file
| Quadrant A |  |
 |
Quadrant B |
|---|---|---|---|
| Quadrant D | 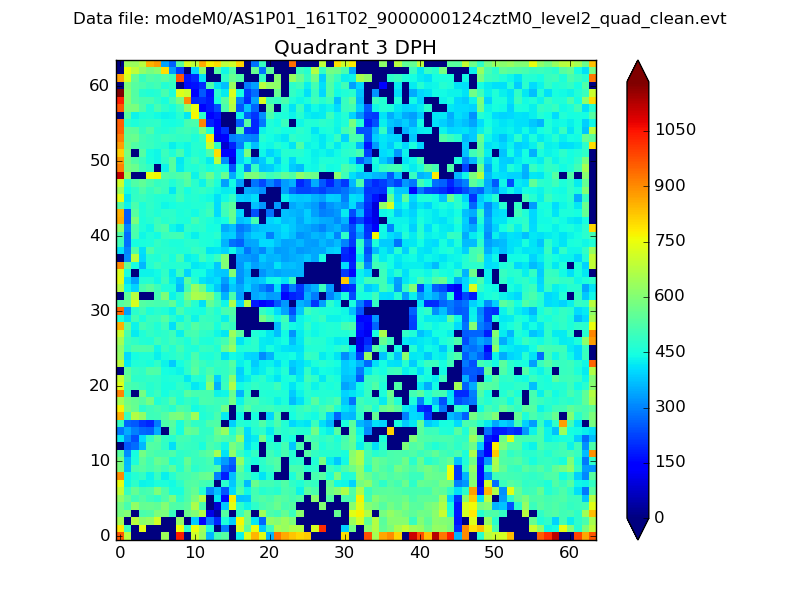 |
 |
Quadrant C |
| Plot type | Count rate plots | Images |
|---|---|---|
| Comparison with Poisson distribution Blue bars denote a histogram of data divided into 1 sec bins. Red curve is a Poisson curve with rate = median count rate of data. |
 |
 |
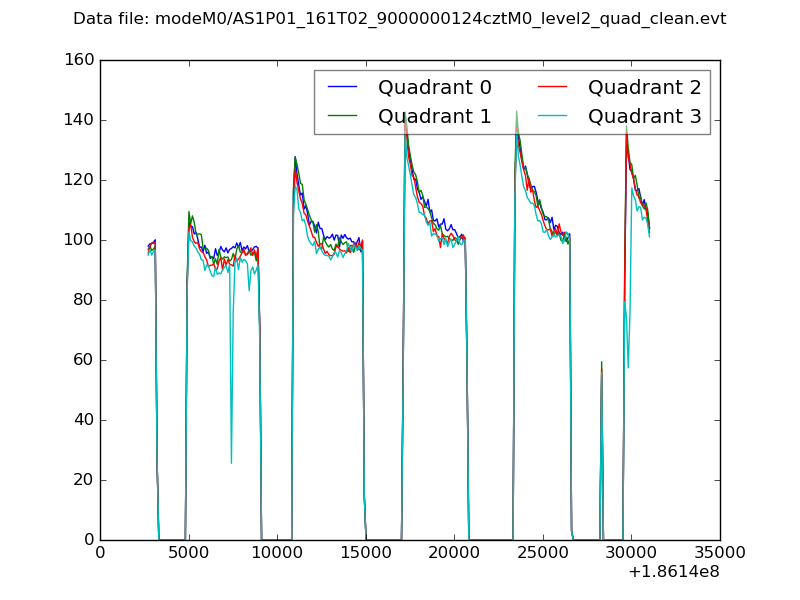
| Quadrant-wise count rates Data is divided into 100 sec bins |
 |
|
| Module-wise count rates for Quadrant A Data is divided into 100 sec bins |
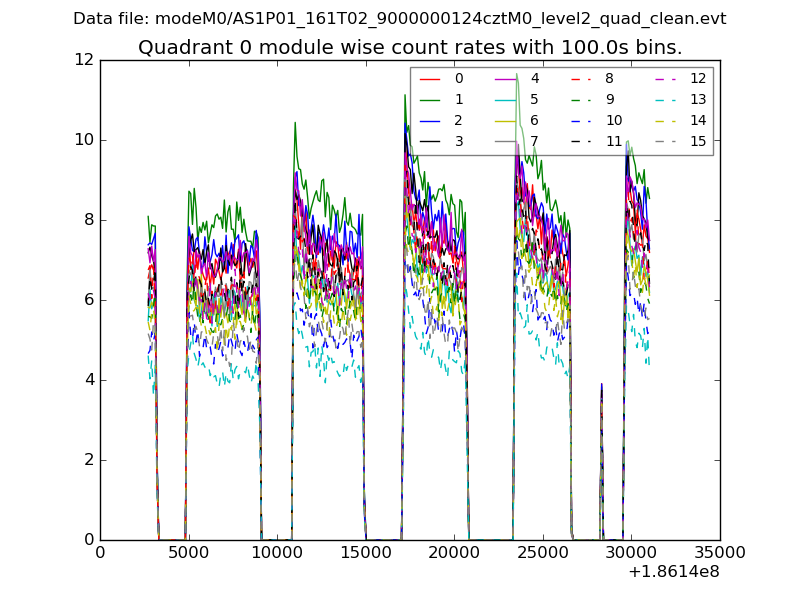 |
 |
| Module-wise count rates for Quadrant B Data is divided into 100 sec bins |
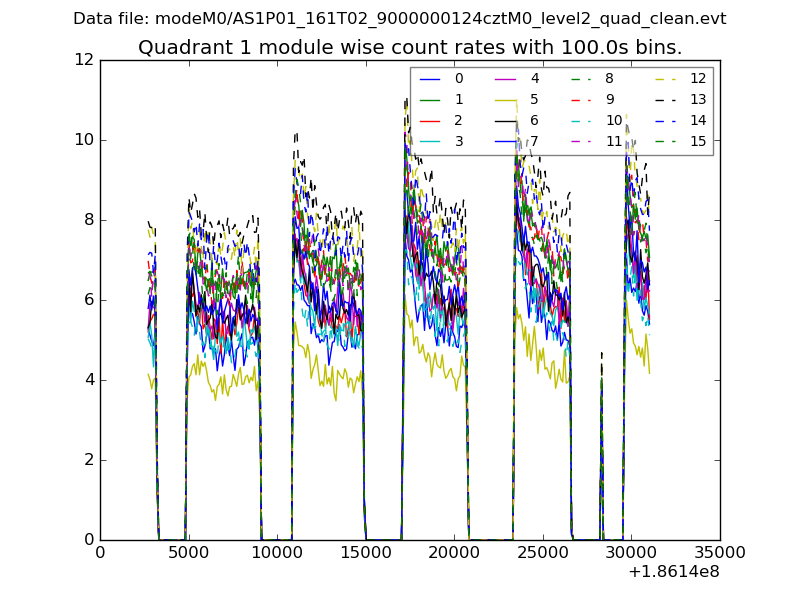 |
 |
| Module-wise count rates for Quadrant C Data is divided into 100 sec bins |
 |
 |
| Module-wise count rates for Quadrant D Data is divided into 100 sec bins |
 |
 |
| Parameter | Plot |
|---|---|
| CZT HV Monitor | 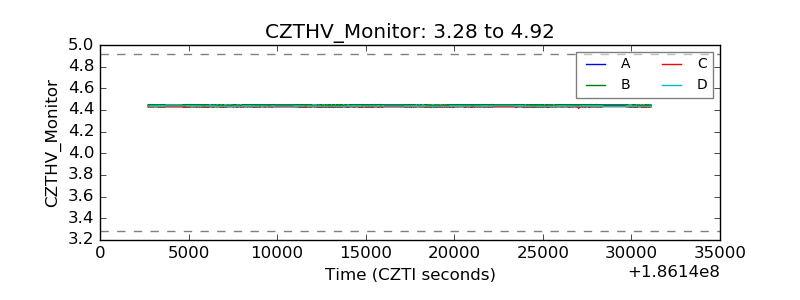 |
| D_VDD | 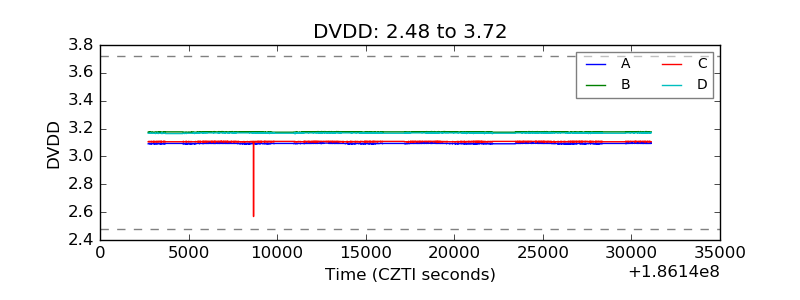 |
| Temperature 1 | 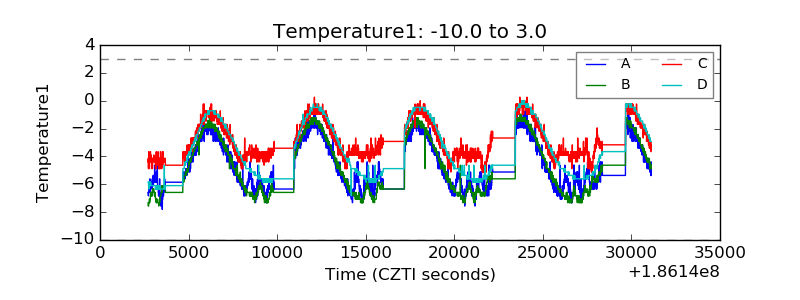 |
| Veto HV Monitor |  |
| Veto LLD |  |
| Alpha Counter |  |
| _CPM_Rate |  |
| CZT Counter | 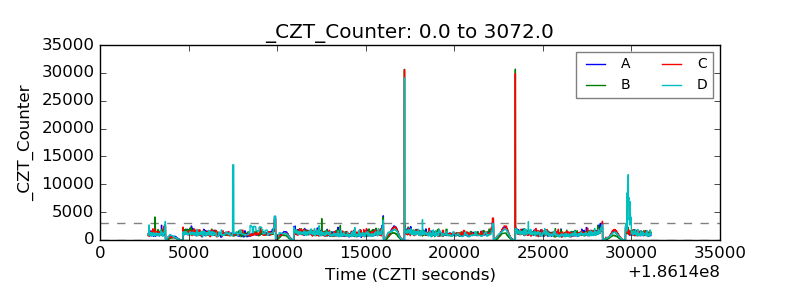 |
| +2.5 Volts monitor | 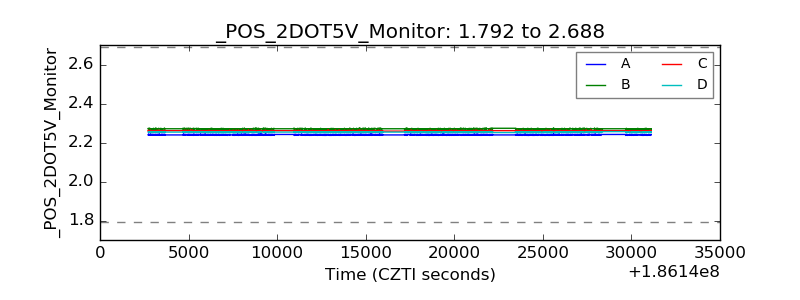 |
| +5 Volts monitor | 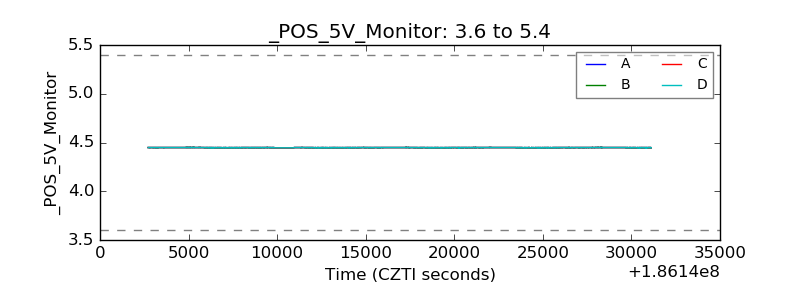 |
| _ROLL_ROT |  |
| _Roll_DEC |  |
| _Roll_RA |  |
| Veto Counter | 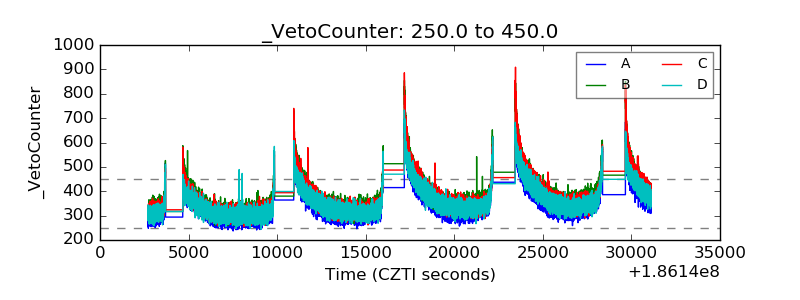 |