| Param | Original file | Final file |
|---|---|---|
| Filename | modeM0/AS1P01_156T01_9000000122cztM0_level2.evt | modeM0/AS1P01_156T01_9000000122cztM0_level2_quad_clean.evt |
| Size (bytes) | 3,207,479,040 | 218,041,920 |
| Size | 3.0 GB | 207.9 MB |
| Events in quadrant A | 24,167,144 | 1,322,199 |
| Events in quadrant B | 25,582,168 | 1,343,608 |
| Events in quadrant C | 23,246,493 | 1,320,669 |
| Events in quadrant D | 22,853,324 | 1,269,033 |
| Mode M9 | |||
|---|---|---|---|
| Quadrant | BADHDUFLAG | Total packets | Discarded packets |
| A | 0 | 15 | 0 |
| B | 0 | 15 | 0 |
| C | 0 | 15 | 0 |
| D | 0 | 15 | 0 |
| Mode SS | |||
|---|---|---|---|
| Quadrant | BADHDUFLAG | Total packets | Discarded packets |
| A | 0 | 398 | 0 |
| B | 0 | 398 | 0 |
| C | 0 | 398 | 0 |
| D | 0 | 398 | 0 |
| Mode M0 | |||
|---|---|---|---|
| Quadrant | BADHDUFLAG | Total packets | Discarded packets |
| A | 0 | 85712 | 0 |
| B | 0 | 89967 | 0 |
| C | 0 | 82980 | 0 |
| D | 0 | 81750 | 0 |
| Quadrant | Total seconds | Saturated seconds | Saturation percentage |
|---|---|---|---|
| A | 19567 | 217 | 1.109010% |
| B | 19567 | 324 | 1.655849% |
| C | 19567 | 142 | 0.725712% |
| D | 19567 | 282 | 1.441202% |
Noise dominated data is calculated using 1-second bins in cleaned event files. If a bin has >2000 counts, and if more than 50% of those come from <1% of pixels, then it is considered to be noise-dominated and hence unusable.
| Quadrant | # 1 sec bins | Bins with >0 counts | Bins with >2000 counts | High rate bins dominated by noise | Noise dominated (total time) | Noise dominated (detector-on time) | Marked lightcurve |
|---|---|---|---|---|---|---|---|
| A | 21157 | 19568 | 793 | 793 | 3.75% | 4.05% |  |
| B | 21157 | 19567 | 1091 | 1091 | 5.16% | 5.58% |  |
| C | 21157 | 19567 | 566 | 566 | 2.68% | 2.89% |  |
| D | 21157 | 19568 | 832 | 832 | 3.93% | 4.25% |  |
Top three noisy pixels from each quadrant. If the there are fewer than three noisy pixels in the level2.evt file, extra rows are filled as -1
| Pixel properties | Quadrant properties | ||||||
|---|---|---|---|---|---|---|---|
| Quadrant | DetID | PixID | Counts | Sigma | Mean | Median | Sigma |
| A | 0 | 214 | 351851 | 230.18 | 6203 | 6251 | 1501.4 |
| A | 11 | 79 | 23659 | 11.59 | 6203 | 6251 | 1501.4 |
| A | 12 | 189 | 19382 | 8.75 | 6203 | 6251 | 1501.4 |
| B | 0 | 184 | 489265 | 320.67 | 6401 | 6434 | 1505.7 |
| B | 15 | 22 | 215671 | 138.96 | 6401 | 6434 | 1505.7 |
| B | 0 | 220 | 198993 | 127.89 | 6401 | 6434 | 1505.7 |
| C | 3 | 111 | 84716 | 47.89 | 5860 | 6077 | 1642.1 |
| C | 9 | 54 | 61832 | 33.95 | 5860 | 6077 | 1642.1 |
| C | 8 | 208 | 52794 | 28.45 | 5860 | 6077 | 1642.1 |
| D | 11 | 131 | 307509 | 181.02 | 5796 | 5944 | 1666.0 |
| D | 12 | 22 | 306420 | 180.36 | 5796 | 5944 | 1666.0 |
| D | 2 | 16 | 219017 | 127.9 | 5796 | 5944 | 1666.0 |
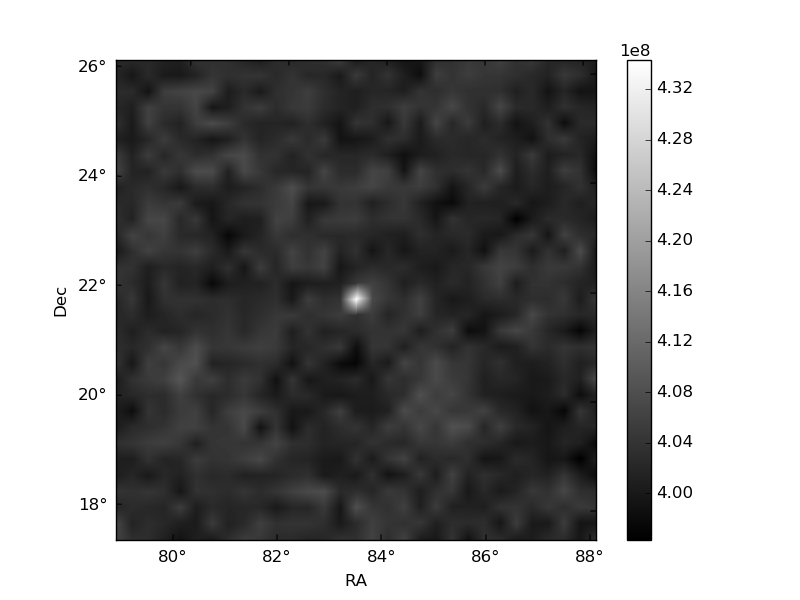
Histogram calculated using DETX and DETY for each event in the final _common_clean file
| Quadrant A | 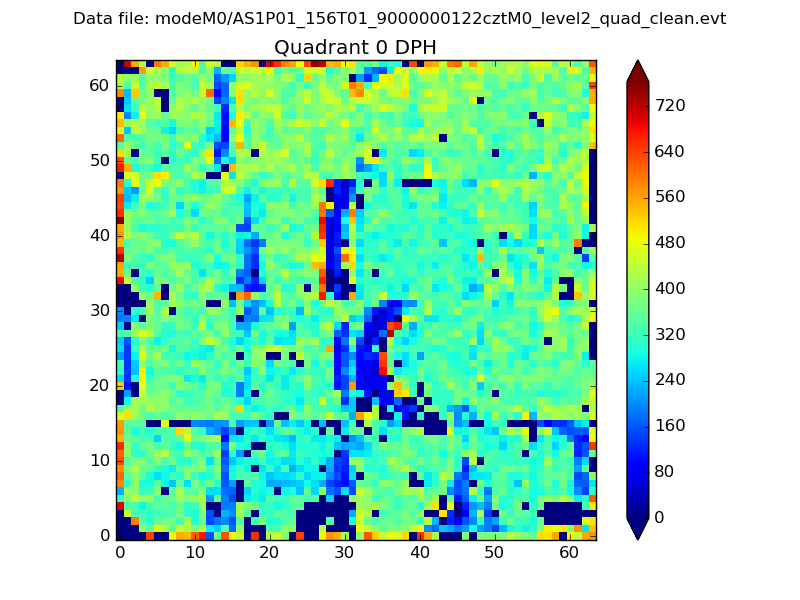 |
 |
Quadrant B |
|---|---|---|---|
| Quadrant D | 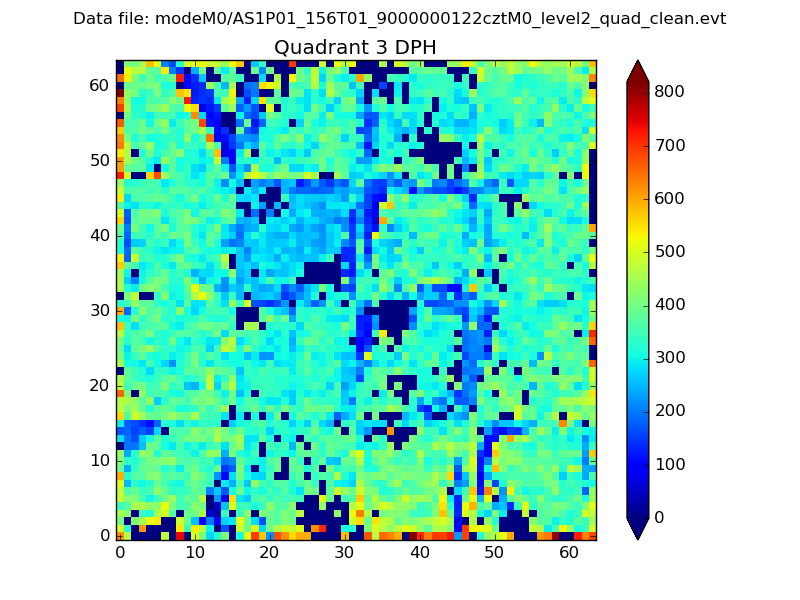 |
 |
Quadrant C |
| Plot type | Count rate plots | Images |
|---|---|---|
| Comparison with Poisson distribution Blue bars denote a histogram of data divided into 1 sec bins. Red curve is a Poisson curve with rate = median count rate of data. |
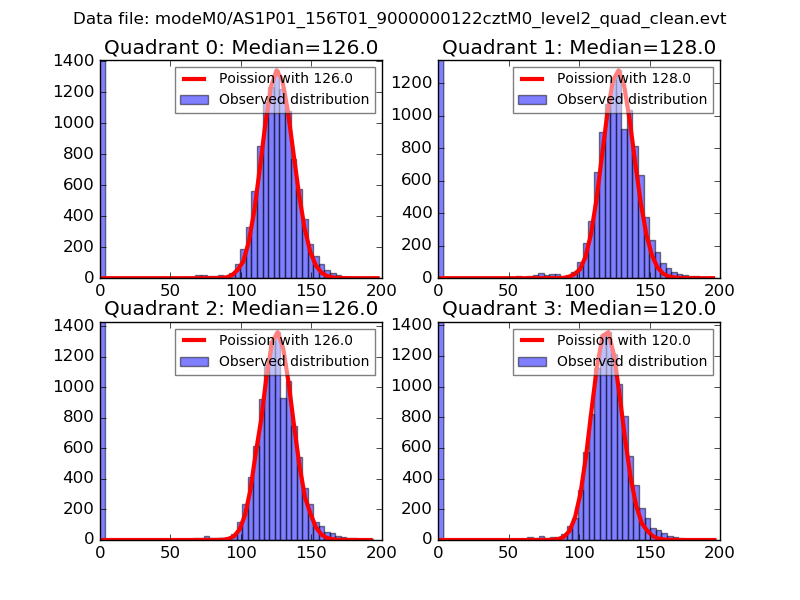 |
 |
| Quadrant-wise count rates Data is divided into 100 sec bins |
 |
|
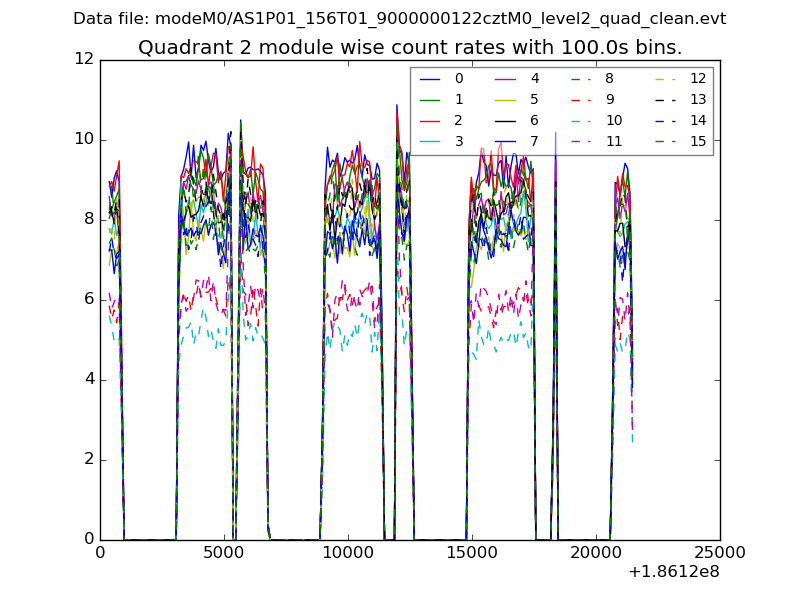
| Module-wise count rates for Quadrant A Data is divided into 100 sec bins |
 |
 |
| Module-wise count rates for Quadrant B Data is divided into 100 sec bins |
 |
 |
| Module-wise count rates for Quadrant C Data is divided into 100 sec bins |
 |
 |
| Module-wise count rates for Quadrant D Data is divided into 100 sec bins |
 |
 |
| Parameter | Plot |
|---|---|
| CZT HV Monitor |  |
| D_VDD |  |
| Temperature 1 |  |
| Veto HV Monitor |  |
| Veto LLD |  |
| Alpha Counter |  |
| _CPM_Rate |  |
| CZT Counter | 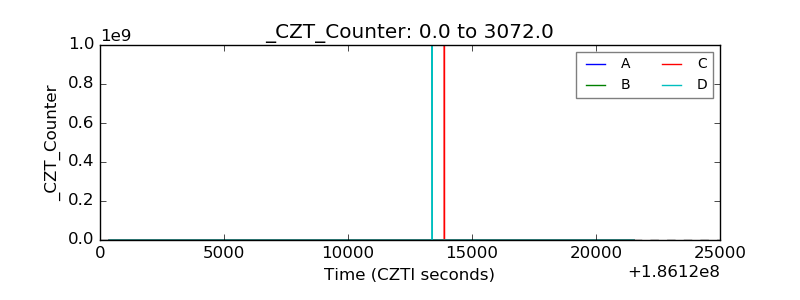 |
| +2.5 Volts monitor | 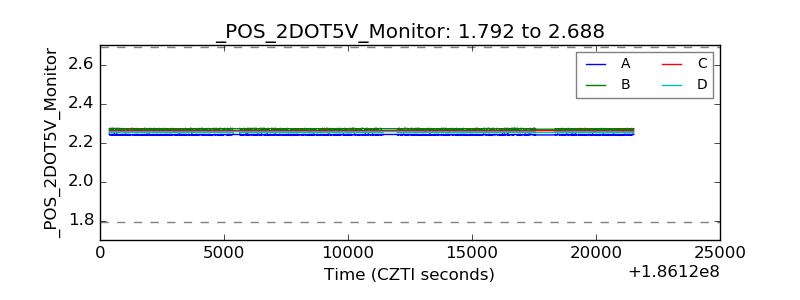 |
| +5 Volts monitor |  |
| _ROLL_ROT |  |
| _Roll_DEC |  |
| _Roll_RA | 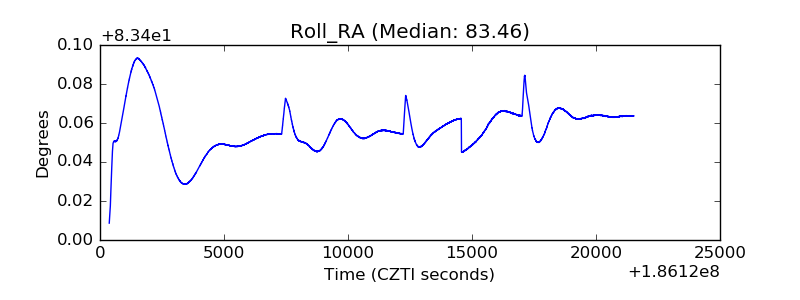 |
| Veto Counter |  |