| Param | Original file | Final file |
|---|---|---|
| Filename | modeM0/AS1P01_165T02_9000000120cztM0_level2.evt | modeM0/AS1P01_165T02_9000000120cztM0_level2_quad_clean.evt |
| Size (bytes) | 6,185,255,040 | 487,209,600 |
| Size | 5.8 GB | 464.6 MB |
| Events in quadrant A | 46,313,395 | 3,053,962 |
| Events in quadrant B | 49,891,372 | 3,066,744 |
| Events in quadrant C | 45,264,099 | 3,019,063 |
| Events in quadrant D | 43,310,886 | 2,967,673 |
| Mode M0 | |||
|---|---|---|---|
| Quadrant | BADHDUFLAG | Total packets | Discarded packets |
| A | 0 | 164912 | 0 |
| B | 0 | 175640 | 0 |
| C | 0 | 161802 | 0 |
| D | 0 | 156469 | 0 |
| Mode SS | |||
|---|---|---|---|
| Quadrant | BADHDUFLAG | Total packets | Discarded packets |
| A | 0 | 784 | 0 |
| B | 0 | 784 | 0 |
| C | 0 | 784 | 0 |
| D | 0 | 784 | 0 |
| Mode M9 | |||
|---|---|---|---|
| Quadrant | BADHDUFLAG | Total packets | Discarded packets |
| A | 0 | 49 | 0 |
| B | 0 | 49 | 0 |
| C | 0 | 49 | 0 |
| D | 0 | 49 | 0 |
| Quadrant | Total seconds | Saturated seconds | Saturation percentage |
|---|---|---|---|
| A | 38585 | 98 | 0.253985% |
| B | 38585 | 334 | 0.865621% |
| C | 38585 | 120 | 0.311002% |
| D | 38585 | 368 | 0.953738% |
Noise dominated data is calculated using 1-second bins in cleaned event files. If a bin has >2000 counts, and if more than 50% of those come from <1% of pixels, then it is considered to be noise-dominated and hence unusable.
| Quadrant | # 1 sec bins | Bins with >0 counts | Bins with >2000 counts | High rate bins dominated by noise | Noise dominated (total time) | Noise dominated (detector-on time) | Marked lightcurve |
|---|---|---|---|---|---|---|---|
| A | 43580 | 38589 | 1654 | 1654 | 3.80% | 4.29% |  |
| B | 43580 | 38587 | 2564 | 2564 | 5.88% | 6.64% |  |
| C | 43580 | 38590 | 1511 | 1511 | 3.47% | 3.92% |  |
| D | 43580 | 38590 | 1727 | 1727 | 3.96% | 4.48% |  |
Top three noisy pixels from each quadrant. If the there are fewer than three noisy pixels in the level2.evt file, extra rows are filled as -1
| Pixel properties | Quadrant properties | ||||||
|---|---|---|---|---|---|---|---|
| Quadrant | DetID | PixID | Counts | Sigma | Mean | Median | Sigma |
| A | 0 | 214 | 218466 | 71.55 | 11990 | 12122 | 2883.7 |
| A | 14 | 79 | 92034 | 27.71 | 11990 | 12122 | 2883.7 |
| A | 11 | 79 | 45611 | 11.61 | 11990 | 12122 | 2883.7 |
| B | 0 | 220 | 511560 | 169.21 | 12573 | 12655 | 2948.4 |
| B | 5 | 191 | 379591 | 124.45 | 12573 | 12655 | 2948.4 |
| B | 0 | 184 | 281660 | 91.24 | 12573 | 12655 | 2948.4 |
| C | 9 | 83 | 196138 | 57.84 | 11419 | 11835 | 3186.7 |
| C | 3 | 111 | 160544 | 46.67 | 11419 | 11835 | 3186.7 |
| C | 15 | 241 | 121806 | 34.51 | 11419 | 11835 | 3186.7 |
| D | 13 | 73 | 991448 | 293.18 | 11021 | 11398 | 3342.9 |
| D | 1 | 4 | 356045 | 103.1 | 11021 | 11398 | 3342.9 |
| D | 2 | 16 | 227492 | 64.64 | 11021 | 11398 | 3342.9 |
Histogram calculated using DETX and DETY for each event in the final _common_clean file
| Quadrant A | 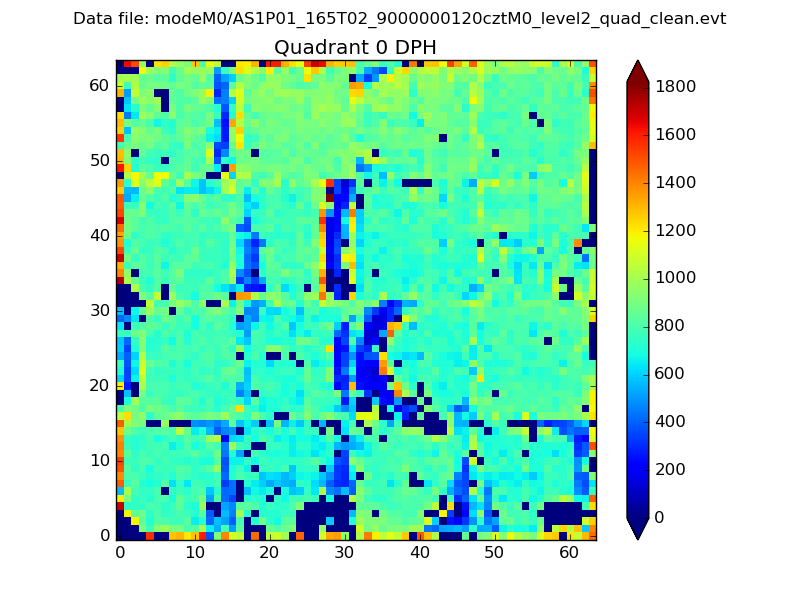 |
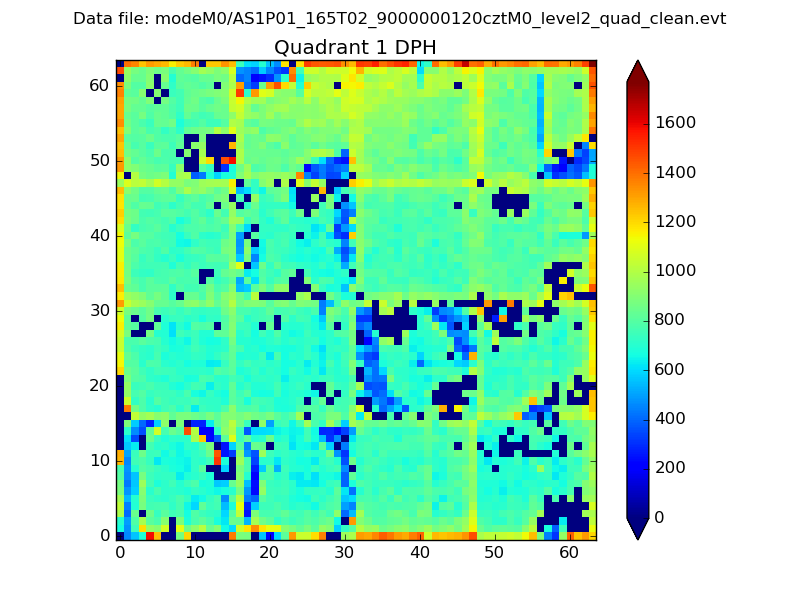 |
Quadrant B |
|---|---|---|---|
| Quadrant D |  |
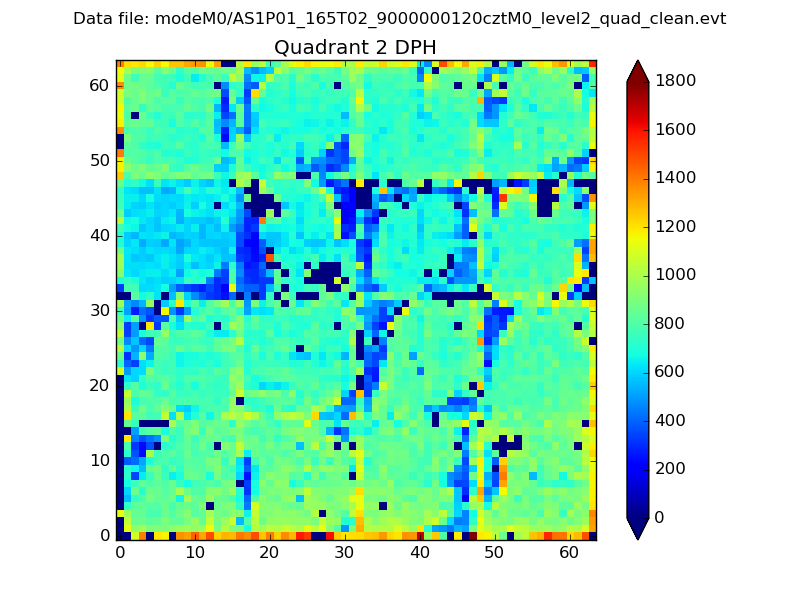 |
Quadrant C |
| Plot type | Count rate plots | Images |
|---|---|---|
| Comparison with Poisson distribution Blue bars denote a histogram of data divided into 1 sec bins. Red curve is a Poisson curve with rate = median count rate of data. |
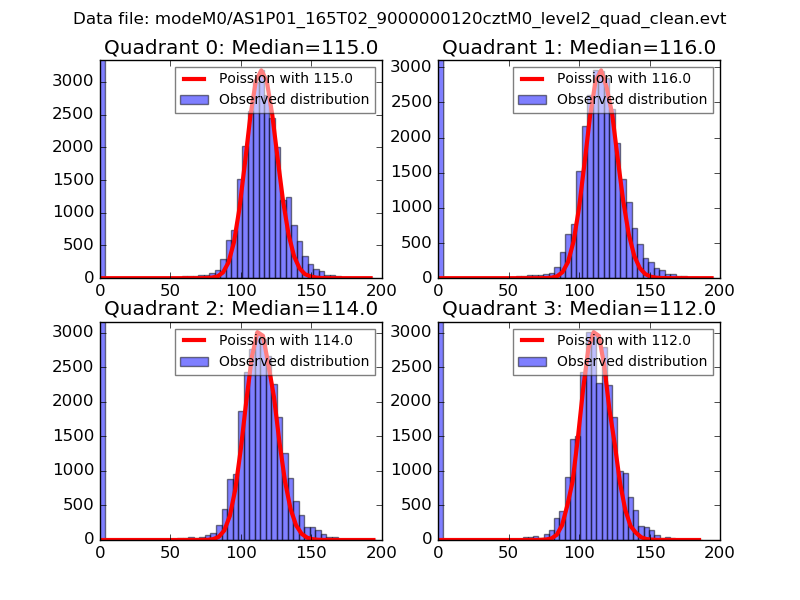 |
 |
| Quadrant-wise count rates Data is divided into 100 sec bins |
 |
|
| Module-wise count rates for Quadrant A Data is divided into 100 sec bins |
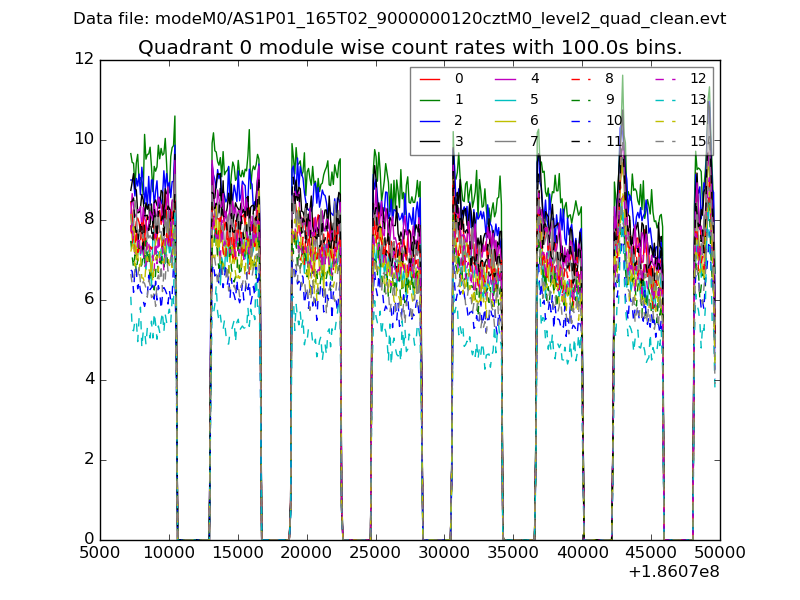 |
 |
| Module-wise count rates for Quadrant B Data is divided into 100 sec bins |
 |
 |
| Module-wise count rates for Quadrant C Data is divided into 100 sec bins |
 |
 |
| Module-wise count rates for Quadrant D Data is divided into 100 sec bins |
 |
 |
| Parameter | Plot |
|---|---|
| CZT HV Monitor |  |
| D_VDD | 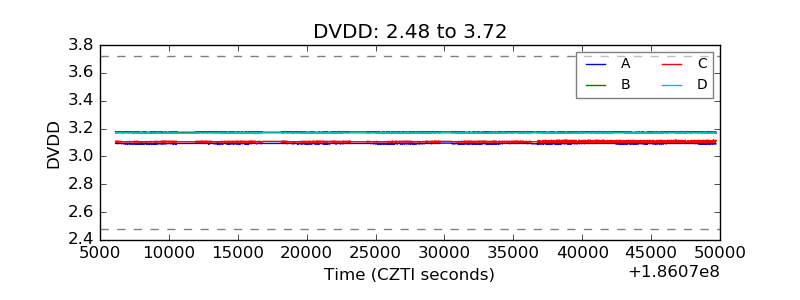 |
| Temperature 1 | 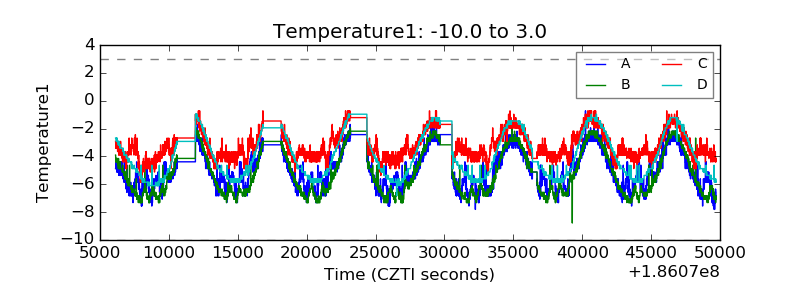 |
| Veto HV Monitor | 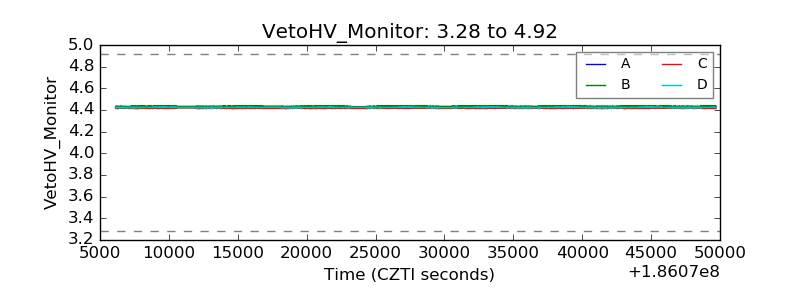 |
| Veto LLD | 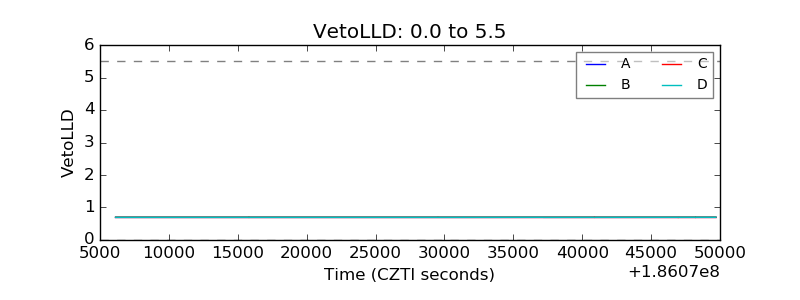 |
| Alpha Counter | 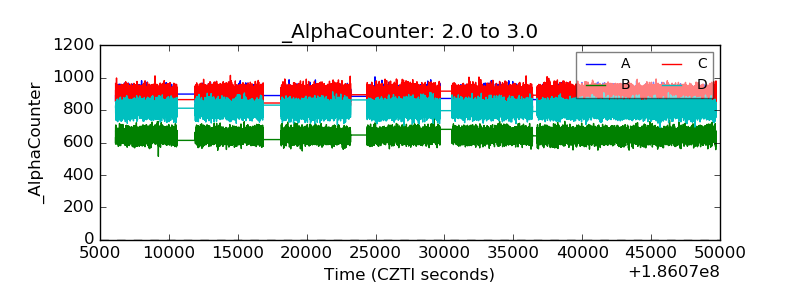 |
| _CPM_Rate |  |
| CZT Counter |  |
| +2.5 Volts monitor |  |
| +5 Volts monitor | 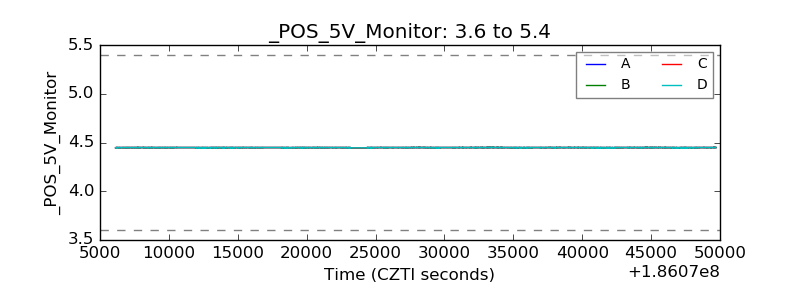 |
| _ROLL_ROT |  |
| _Roll_DEC |  |
| _Roll_RA |  |
| Veto Counter |  |