| Param | Original file | Final file |
|---|---|---|
| Filename | modeM0/AS1P01_156T01_9000000118cztM0_level2.evt | modeM0/AS1P01_156T01_9000000118cztM0_level2_quad_clean.evt |
| Size (bytes) | 5,928,085,440 | 462,070,080 |
| Size | 5.5 GB | 440.7 MB |
| Events in quadrant A | 44,063,770 | 2,897,908 |
| Events in quadrant B | 47,677,188 | 2,916,720 |
| Events in quadrant C | 43,301,688 | 2,897,288 |
| Events in quadrant D | 42,101,114 | 2,790,833 |
| Mode M0 | |||
|---|---|---|---|
| Quadrant | BADHDUFLAG | Total packets | Discarded packets |
| A | 0 | 156650 | 0 |
| B | 0 | 167480 | 0 |
| C | 0 | 154407 | 0 |
| D | 0 | 150880 | 0 |
| Mode M9 | |||
|---|---|---|---|
| Quadrant | BADHDUFLAG | Total packets | Discarded packets |
| A | 0 | 52 | 0 |
| B | 0 | 52 | 0 |
| C | 0 | 52 | 0 |
| D | 0 | 52 | 0 |
| Mode SS | |||
|---|---|---|---|
| Quadrant | BADHDUFLAG | Total packets | Discarded packets |
| A | 0 | 738 | 0 |
| B | 0 | 738 | 0 |
| C | 0 | 738 | 0 |
| D | 0 | 738 | 0 |
| Quadrant | Total seconds | Saturated seconds | Saturation percentage |
|---|---|---|---|
| A | 36296 | 345 | 0.950518% |
| B | 36296 | 573 | 1.578686% |
| C | 36296 | 320 | 0.881640% |
| D | 36296 | 495 | 1.363787% |
Noise dominated data is calculated using 1-second bins in cleaned event files. If a bin has >2000 counts, and if more than 50% of those come from <1% of pixels, then it is considered to be noise-dominated and hence unusable.
| Quadrant | # 1 sec bins | Bins with >0 counts | Bins with >2000 counts | High rate bins dominated by noise | Noise dominated (total time) | Noise dominated (detector-on time) | Marked lightcurve |
|---|---|---|---|---|---|---|---|
| A | 40475 | 36299 | 1481 | 1481 | 3.66% | 4.08% |  |
| B | 40475 | 36300 | 2313 | 2313 | 5.71% | 6.37% |  |
| C | 40475 | 36299 | 1260 | 1260 | 3.11% | 3.47% |  |
| D | 40475 | 36298 | 1852 | 1852 | 4.58% | 5.10% | 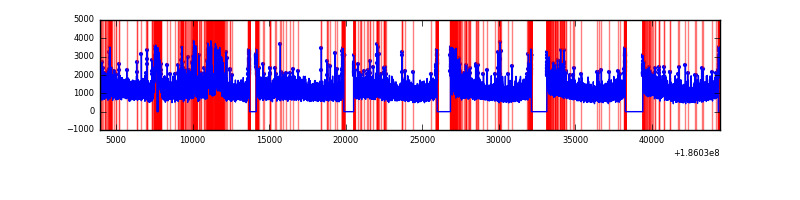 |
Top three noisy pixels from each quadrant. If the there are fewer than three noisy pixels in the level2.evt file, extra rows are filled as -1
| Pixel properties | Quadrant properties | ||||||
|---|---|---|---|---|---|---|---|
| Quadrant | DetID | PixID | Counts | Sigma | Mean | Median | Sigma |
| A | 0 | 231 | 166251 | 56.02 | 11409 | 11541 | 2761.7 |
| A | 15 | 171 | 121129 | 39.68 | 11409 | 11541 | 2761.7 |
| A | 15 | 17 | 47091 | 12.87 | 11409 | 11541 | 2761.7 |
| B | 5 | 191 | 526336 | 184.79 | 11886 | 11968 | 2783.6 |
| B | 8 | 234 | 325996 | 112.82 | 11886 | 11968 | 2783.6 |
| B | 5 | 249 | 308096 | 106.38 | 11886 | 11968 | 2783.6 |
| C | 15 | 241 | 207898 | 64.8 | 10910 | 11334 | 3033.5 |
| C | 3 | 111 | 148487 | 45.21 | 10910 | 11334 | 3033.5 |
| C | 12 | 4 | 86164 | 24.67 | 10910 | 11334 | 3033.5 |
| D | 7 | 207 | 1389829 | 420.81 | 10576 | 10985 | 3276.6 |
| D | 10 | 85 | 503512 | 150.32 | 10576 | 10985 | 3276.6 |
| D | 1 | 4 | 387152 | 114.8 | 10576 | 10985 | 3276.6 |
Histogram calculated using DETX and DETY for each event in the final _common_clean file
| Quadrant A |  |
 |
Quadrant B |
|---|---|---|---|
| Quadrant D |  |
 |
Quadrant C |
| Plot type | Count rate plots | Images |
|---|---|---|
| Comparison with Poisson distribution Blue bars denote a histogram of data divided into 1 sec bins. Red curve is a Poisson curve with rate = median count rate of data. |
 |
 |
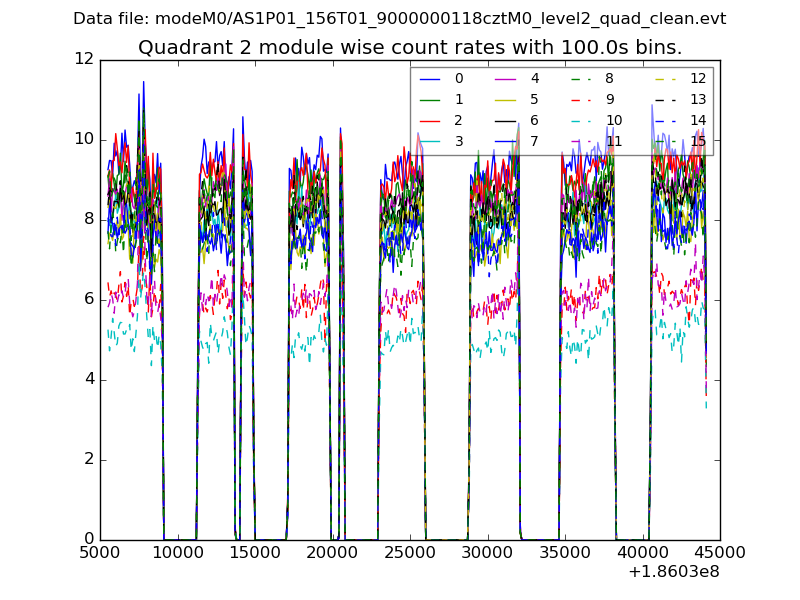
| Quadrant-wise count rates Data is divided into 100 sec bins |
 |
|
| Module-wise count rates for Quadrant A Data is divided into 100 sec bins |
 |
 |
| Module-wise count rates for Quadrant B Data is divided into 100 sec bins |
 |
 |
| Module-wise count rates for Quadrant C Data is divided into 100 sec bins |
 |
 |
| Module-wise count rates for Quadrant D Data is divided into 100 sec bins |
 |
 |
| Parameter | Plot |
|---|---|
| CZT HV Monitor |  |
| D_VDD |  |
| Temperature 1 |  |
| Veto HV Monitor |  |
| Veto LLD |  |
| Alpha Counter |  |
| _CPM_Rate |  |
| CZT Counter |  |
| +2.5 Volts monitor |  |
| +5 Volts monitor |  |
| _ROLL_ROT |  |
| _Roll_DEC |  |
| _Roll_RA |  |
| Veto Counter |  |