| Param | Original file | Final file |
|---|---|---|
| Filename | modeM0/AS1P01_165T02_9000000116cztM0_level2.evt | modeM0/AS1P01_165T02_9000000116cztM0_level2_quad_clean.evt |
| Size (bytes) | 6,855,664,320 | 504,262,080 |
| Size | 6.4 GB | 480.9 MB |
| Events in quadrant A | 61,717,087 | 3,040,659 |
| Events in quadrant B | 51,735,155 | 3,208,271 |
| Events in quadrant C | 46,872,938 | 3,170,569 |
| Events in quadrant D | 44,677,146 | 3,114,562 |
| Mode M9 | |||
|---|---|---|---|
| Quadrant | BADHDUFLAG | Total packets | Discarded packets |
| A | 0 | 59 | 0 |
| B | 0 | 59 | 0 |
| C | 0 | 59 | 0 |
| D | 0 | 59 | 0 |
| Mode M0 | |||
|---|---|---|---|
| Quadrant | BADHDUFLAG | Total packets | Discarded packets |
| A | 0 | 212341 | 0 |
| B | 0 | 181935 | 0 |
| C | 0 | 167579 | 0 |
| D | 0 | 161389 | 0 |
| Mode SS | |||
|---|---|---|---|
| Quadrant | BADHDUFLAG | Total packets | Discarded packets |
| A | 0 | 808 | 0 |
| B | 0 | 808 | 0 |
| C | 0 | 808 | 0 |
| D | 0 | 808 | 0 |
| Quadrant | Total seconds | Saturated seconds | Saturation percentage |
|---|---|---|---|
| A | 39886 | 4752 | 11.913955% |
| B | 39885 | 307 | 0.769713% |
| C | 39882 | 130 | 0.325962% |
| D | 39886 | 233 | 0.584165% |
Noise dominated data is calculated using 1-second bins in cleaned event files. If a bin has >2000 counts, and if more than 50% of those come from <1% of pixels, then it is considered to be noise-dominated and hence unusable.
| Quadrant | # 1 sec bins | Bins with >0 counts | Bins with >2000 counts | High rate bins dominated by noise | Noise dominated (total time) | Noise dominated (detector-on time) | Marked lightcurve |
|---|---|---|---|---|---|---|---|
| A | 45401 | 39889 | 9081 | 9081 | 20.00% | 22.77% |  |
| B | 45401 | 39891 | 2900 | 2900 | 6.39% | 7.27% |  |
| C | 45401 | 39889 | 1584 | 1584 | 3.49% | 3.97% |  |
| D | 45401 | 39891 | 1580 | 1580 | 3.48% | 3.96% |  |
Top three noisy pixels from each quadrant. If the there are fewer than three noisy pixels in the level2.evt file, extra rows are filled as -1
| Pixel properties | Quadrant properties | ||||||
|---|---|---|---|---|---|---|---|
| Quadrant | DetID | PixID | Counts | Sigma | Mean | Median | Sigma |
| A | 15 | 127 | 16052432 | 5690.27 | 11748 | 11848 | 2819.0 |
| A | 15 | 171 | 373355 | 128.24 | 11748 | 11848 | 2819.0 |
| A | 14 | 170 | 147159 | 48.0 | 11748 | 11848 | 2819.0 |
| B | 8 | 38 | 1022498 | 334.79 | 12921 | 12983 | 3015.4 |
| B | 0 | 220 | 361490 | 115.58 | 12921 | 12983 | 3015.4 |
| B | 0 | 207 | 256339 | 80.71 | 12921 | 12983 | 3015.4 |
| C | 8 | 208 | 318102 | 93.72 | 11732 | 12146 | 3264.6 |
| C | 3 | 111 | 190467 | 54.62 | 11732 | 12146 | 3264.6 |
| C | 3 | 79 | 127569 | 35.36 | 11732 | 12146 | 3264.6 |
| D | 13 | 200 | 753168 | 216.44 | 11336 | 11728 | 3425.6 |
| D | 1 | 4 | 321476 | 90.42 | 11336 | 11728 | 3425.6 |
| D | 2 | 16 | 301741 | 84.66 | 11336 | 11728 | 3425.6 |
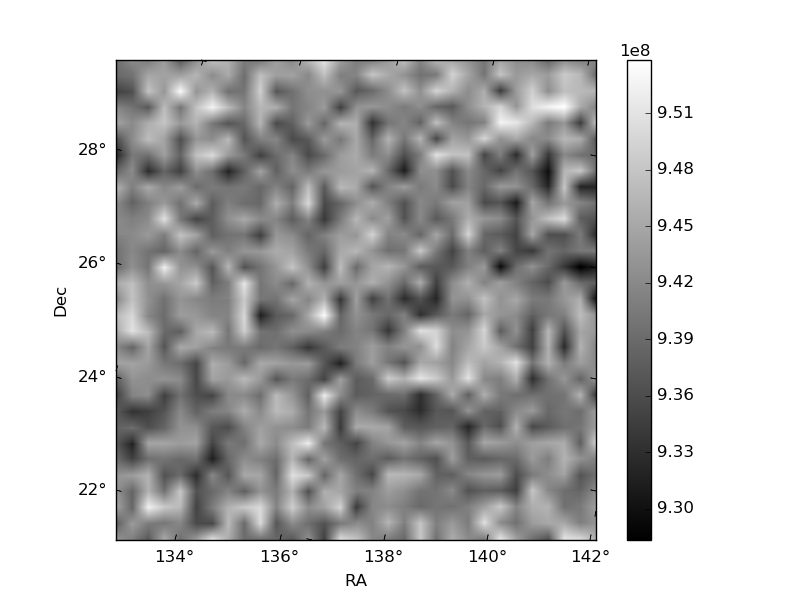
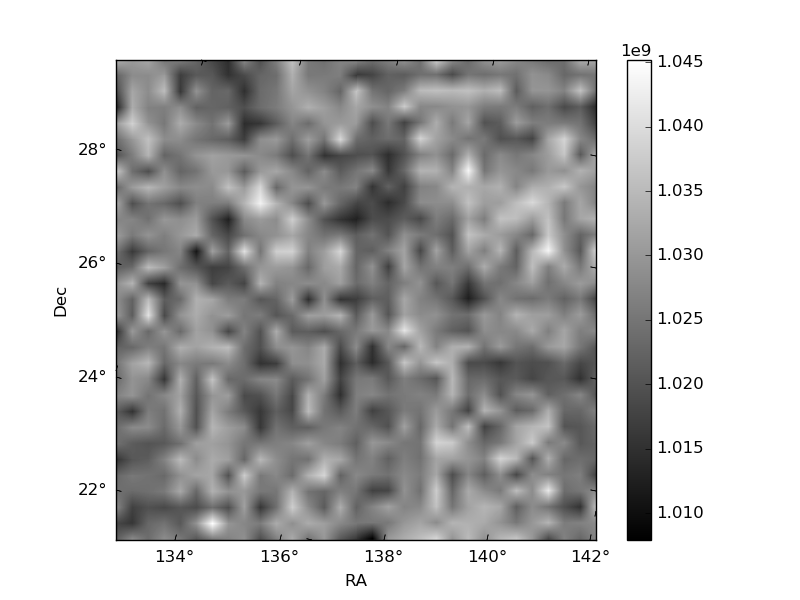
Histogram calculated using DETX and DETY for each event in the final _common_clean file
| Quadrant A |  |
 |
Quadrant B |
|---|---|---|---|
| Quadrant D |  |
 |
Quadrant C |
| Plot type | Count rate plots | Images |
|---|---|---|
| Comparison with Poisson distribution Blue bars denote a histogram of data divided into 1 sec bins. Red curve is a Poisson curve with rate = median count rate of data. |
 |
 |
| Quadrant-wise count rates Data is divided into 100 sec bins |
 |
|
| Module-wise count rates for Quadrant A Data is divided into 100 sec bins |
 |
 |
| Module-wise count rates for Quadrant B Data is divided into 100 sec bins |
 |
 |
| Module-wise count rates for Quadrant C Data is divided into 100 sec bins |
 |
 |
| Module-wise count rates for Quadrant D Data is divided into 100 sec bins |
 |
 |
| Parameter | Plot |
|---|---|
| CZT HV Monitor |  |
| D_VDD |  |
| Temperature 1 |  |
| Veto HV Monitor |  |
| Veto LLD |  |
| Alpha Counter | 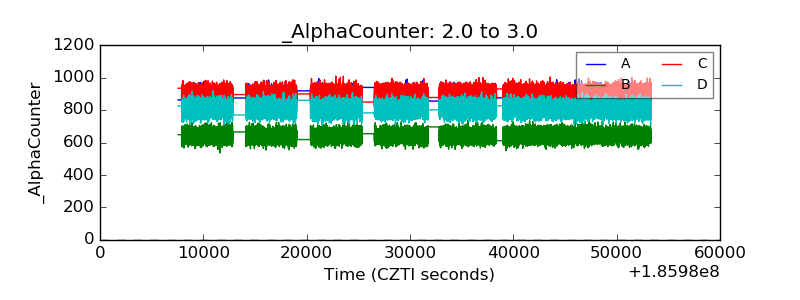 |
| _CPM_Rate |  |
| CZT Counter |  |
| +2.5 Volts monitor |  |
| +5 Volts monitor | 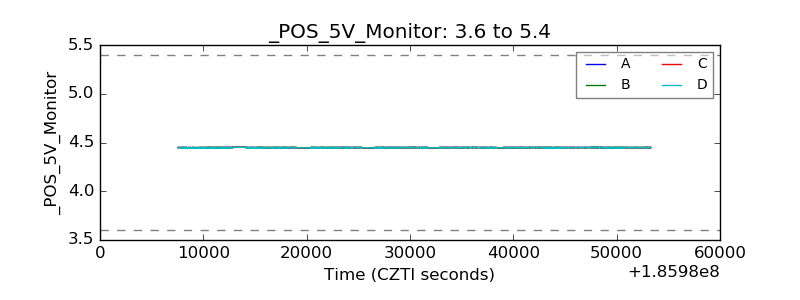 |
| _ROLL_ROT |  |
| _Roll_DEC |  |
| _Roll_RA |  |
| Veto Counter | 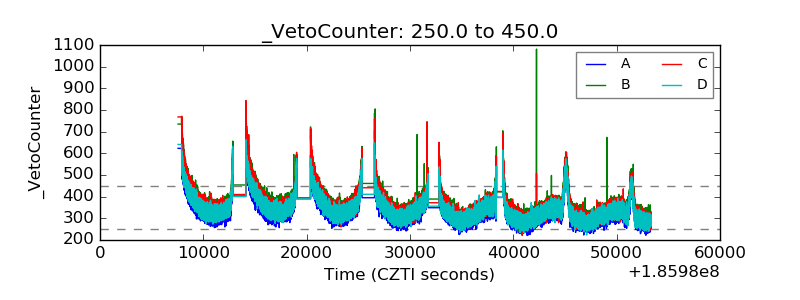 |