| Param | Original file | Final file |
|---|---|---|
| Filename | modeM0/AS1T01_001T01_9000000110cztM0_level2.evt | modeM0/AS1T01_001T01_9000000110cztM0_level2_quad_clean.evt |
| Size (bytes) | 1,832,476,672 | 183,614,400 |
| Size | 1.7 GB | 175.1 MB |
| Events in quadrant A | 15,535,938 | 1,188,121 |
| Events in quadrant B | 15,909,015 | 1,196,322 |
| Events in quadrant C | 14,704,063 | 1,174,976 |
| Events in quadrant D | 14,346,266 | 1,142,708 |
| Mode M0 | |||
|---|---|---|---|
| Quadrant | BADHDUFLAG | Total packets | Discarded packets |
| A | 0 | 54959 | 0 |
| B | 0 | 56062 | 0 |
| C | 0 | 52495 | 0 |
| D | 0 | 51455 | 0 |
| Mode SS | |||
|---|---|---|---|
| Quadrant | BADHDUFLAG | Total packets | Discarded packets |
| A | 0 | 250 | 0 |
| B | 0 | 250 | 0 |
| C | 0 | 250 | 0 |
| D | 0 | 250 | 0 |
| Quadrant | Total seconds | Saturated seconds | Saturation percentage |
|---|---|---|---|
| A | 12424 | 188 | 1.513200% |
| B | 12424 | 141 | 1.134900% |
| C | 12424 | 55 | 0.442692% |
| D | 12424 | 138 | 1.110753% |
Noise dominated data is calculated using 1-second bins in cleaned event files. If a bin has >2000 counts, and if more than 50% of those come from <1% of pixels, then it is considered to be noise-dominated and hence unusable.
| Quadrant | # 1 sec bins | Bins with >0 counts | Bins with >2000 counts | High rate bins dominated by noise | Noise dominated (total time) | Noise dominated (detector-on time) | Marked lightcurve |
|---|---|---|---|---|---|---|---|
| A | 12489 | 12426 | 848 | 848 | 6.79% | 6.82% |  |
| B | 12488 | 12425 | 840 | 840 | 6.73% | 6.76% |  |
| C | 12489 | 12426 | 506 | 506 | 4.05% | 4.07% | 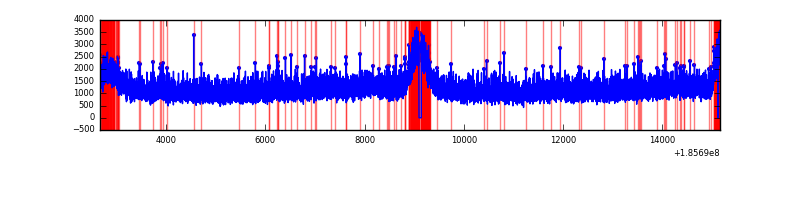 |
| D | 12489 | 12426 | 589 | 589 | 4.72% | 4.74% |  |
Top three noisy pixels from each quadrant. If the there are fewer than three noisy pixels in the level2.evt file, extra rows are filled as -1
| Pixel properties | Quadrant properties | ||||||
|---|---|---|---|---|---|---|---|
| Quadrant | DetID | PixID | Counts | Sigma | Mean | Median | Sigma |
| A | 8 | 192 | 256556 | 263.12 | 3956 | 3982 | 959.9 |
| A | 12 | 236 | 43811 | 41.49 | 3956 | 3982 | 959.9 |
| A | 10 | 133 | 39622 | 37.13 | 3956 | 3982 | 959.9 |
| B | 15 | 22 | 96824 | 95.86 | 4087 | 4100 | 967.3 |
| B | 0 | 23 | 79172 | 77.61 | 4087 | 4100 | 967.3 |
| B | 8 | 234 | 64230 | 62.16 | 4087 | 4100 | 967.3 |
| C | 9 | 83 | 103570 | 96.69 | 3688 | 3816 | 1031.7 |
| C | 15 | 241 | 78852 | 72.73 | 3688 | 3816 | 1031.7 |
| C | 3 | 111 | 68510 | 62.71 | 3688 | 3816 | 1031.7 |
| D | 1 | 4 | 544247 | 476.86 | 3611 | 3741 | 1133.5 |
| D | 13 | 25 | 190380 | 164.66 | 3611 | 3741 | 1133.5 |
| D | 9 | 41 | 26771 | 20.32 | 3611 | 3741 | 1133.5 |
Histogram calculated using DETX and DETY for each event in the final _common_clean file
| Quadrant A | 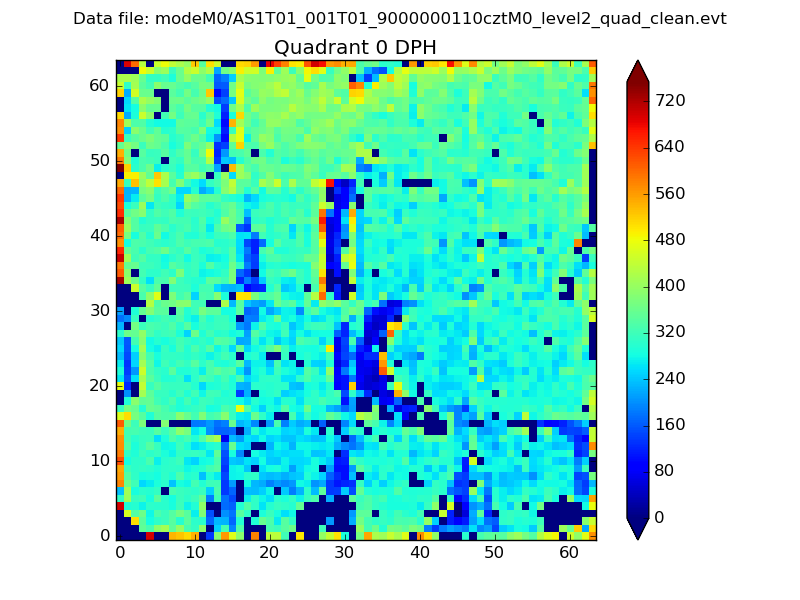 |
 |
Quadrant B |
|---|---|---|---|
| Quadrant D |  |
 |
Quadrant C |
| Plot type | Count rate plots | Images |
|---|---|---|
| Comparison with Poisson distribution Blue bars denote a histogram of data divided into 1 sec bins. Red curve is a Poisson curve with rate = median count rate of data. |
 |
 |
| Quadrant-wise count rates Data is divided into 100 sec bins |
 |
|
| Module-wise count rates for Quadrant A Data is divided into 100 sec bins |
 |
 |
| Module-wise count rates for Quadrant B Data is divided into 100 sec bins |
 |
 |
| Module-wise count rates for Quadrant C Data is divided into 100 sec bins |
 |
 |
| Module-wise count rates for Quadrant D Data is divided into 100 sec bins |
 |
 |
| Parameter | Plot |
|---|---|
| CZT HV Monitor |  |
| D_VDD | 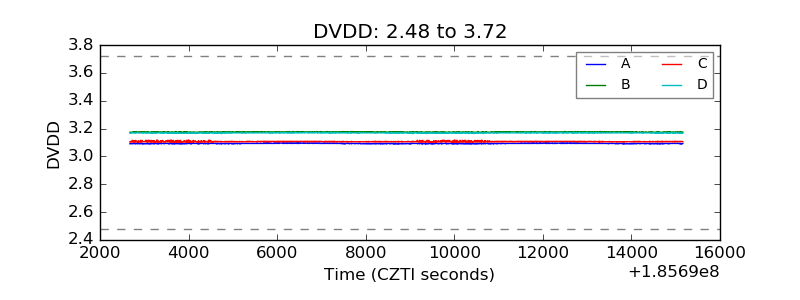 |
| Temperature 1 |  |
| Veto HV Monitor |  |
| Veto LLD | 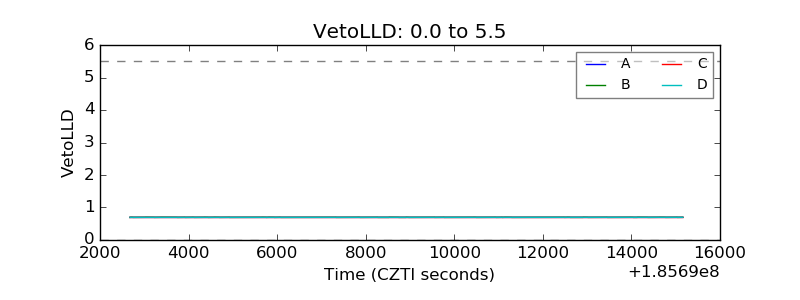 |
| Alpha Counter |  |
| _CPM_Rate |  |
| CZT Counter |  |
| +2.5 Volts monitor |  |
| +5 Volts monitor |  |
| _ROLL_ROT |  |
| _Roll_DEC |  |
| _Roll_RA |  |
| Veto Counter |  |