| Param | Original file | Final file |
|---|---|---|
| Filename | modeM0/AS1P01_142T01_9000000102cztM0_level2_bc.evt | modeM0/AS1P01_142T01_9000000102cztM0_level2_quad_clean.evt |
| Size (bytes) | 376,963,200 | 89,349,120 |
| Size | 359.5 MB | 85.2 MB |
| Events in quadrant A | 2,017,648 | 538,129 |
| Events in quadrant B | 2,626,093 | 539,334 |
| Events in quadrant C | 3,230,276 | 523,026 |
| Events in quadrant D | 2,957,513 | 515,130 |
| Mode M0 | |||
|---|---|---|---|
| Quadrant | BADHDUFLAG | Total packets | Discarded packets |
| A | 0 | 36681 | 0 |
| B | 0 | 39426 | 0 |
| C | 0 | 39419 | 0 |
| D | 0 | 36859 | 0 |
| Mode SS | |||
|---|---|---|---|
| Quadrant | BADHDUFLAG | Total packets | Discarded packets |
| A | 0 | 174 | 0 |
| B | 0 | 174 | 0 |
| C | 0 | 174 | 0 |
| D | 0 | 174 | 0 |
| Mode M9 | |||
|---|---|---|---|
| Quadrant | BADHDUFLAG | Total packets | Discarded packets |
| A | 0 | 15 | 0 |
| B | 0 | 15 | 0 |
| C | 0 | 15 | 0 |
| D | 0 | 15 | 0 |
| Quadrant | Total seconds | Saturated seconds | Saturation percentage |
|---|---|---|---|
| A | 8497 | 64 | 0.753207% |
| B | 8497 | 207 | 2.436154% |
| C | 8497 | 14 | 0.164764% |
| D | 8497 | 58 | 0.682594% |
Noise dominated data is calculated using 1-second bins in cleaned event files. If a bin has >2000 counts, and if more than 50% of those come from <1% of pixels, then it is considered to be noise-dominated and hence unusable.
| Quadrant | # 1 sec bins | Bins with >0 counts | Bins with >2000 counts | High rate bins dominated by noise | Noise dominated (total time) | Noise dominated (detector-on time) | Marked lightcurve |
|---|---|---|---|---|---|---|---|
| A | 10012 | 8497 | 10 | 10 | 0.10% | 0.12% |  |
| B | 10012 | 8497 | 161 | 161 | 1.61% | 1.89% | 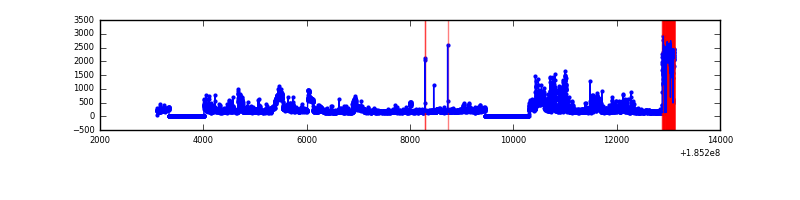 |
| C | 10012 | 8497 | 0 | 0 | 0.00% | 0.00% |  |
| D | 10012 | 8497 | 1 | 1 | 0.01% | 0.01% |  |
Top three noisy pixels from each quadrant. If the there are fewer than three noisy pixels in the level2.evt file, extra rows are filled as -1
| Pixel properties | Quadrant properties | ||||||
|---|---|---|---|---|---|---|---|
| Quadrant | DetID | PixID | Counts | Sigma | Mean | Median | Sigma |
| A | 10 | 216 | 242982 | 3156.23 | 360 | 351 | 76.9 |
| A | 15 | 171 | 170876 | 2218.25 | 360 | 351 | 76.9 |
| A | 12 | 133 | 168253 | 2184.13 | 360 | 351 | 76.9 |
| B | 5 | 191 | 828635 | 12076.75 | 367 | 355 | 68.6 |
| B | 5 | 247 | 249069 | 3626.38 | 367 | 355 | 68.6 |
| B | 0 | 220 | 47216 | 683.26 | 367 | 355 | 68.6 |
| C | 3 | 31 | 423867 | 5562.78 | 352 | 344 | 76.1 |
| C | 3 | 15 | 389418 | 5110.3 | 352 | 344 | 76.1 |
| C | 3 | 175 | 321054 | 4212.38 | 352 | 344 | 76.1 |
| D | 0 | 25 | 1238357 | 15803.6 | 352 | 340 | 78.3 |
| D | 12 | 188 | 161582 | 2058.29 | 352 | 340 | 78.3 |
| D | 1 | 4 | 95285 | 1212.0 | 352 | 340 | 78.3 |
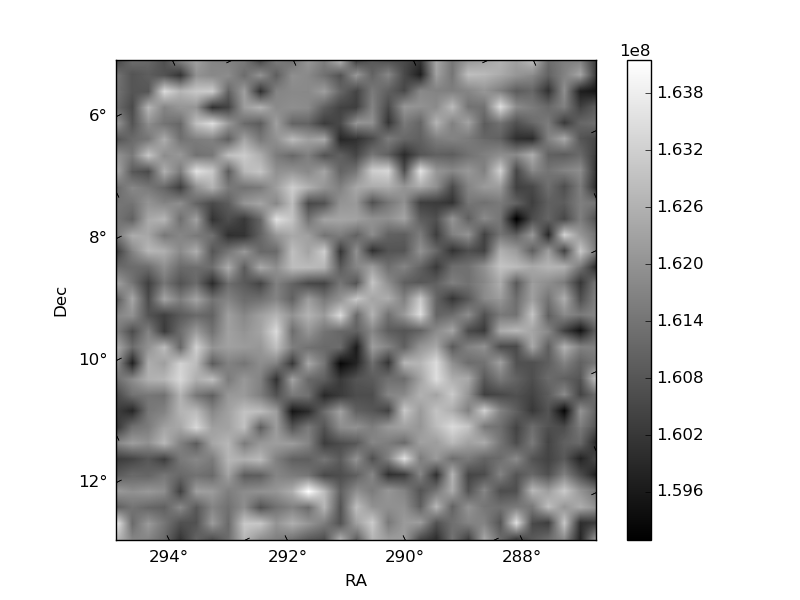
Histogram calculated using DETX and DETY for each event in the final _common_clean file
| Quadrant A |  |
 |
Quadrant B |
|---|---|---|---|
| Quadrant D |  |
 |
Quadrant C |
| Plot type | Count rate plots | Images |
|---|---|---|
| Comparison with Poisson distribution Blue bars denote a histogram of data divided into 1 sec bins. Red curve is a Poisson curve with rate = median count rate of data. |
 |
 |
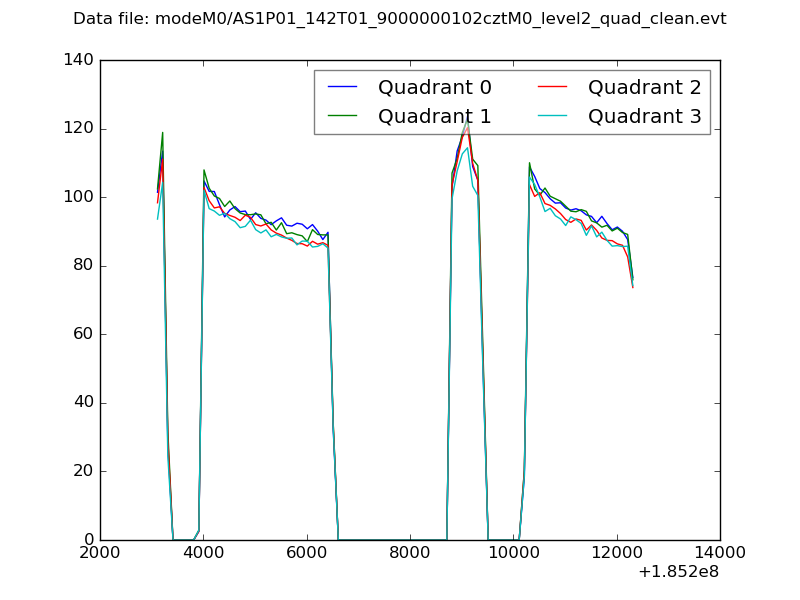
| Quadrant-wise count rates Data is divided into 100 sec bins |
 |
|
| Module-wise count rates for Quadrant A Data is divided into 100 sec bins |
 |
 |
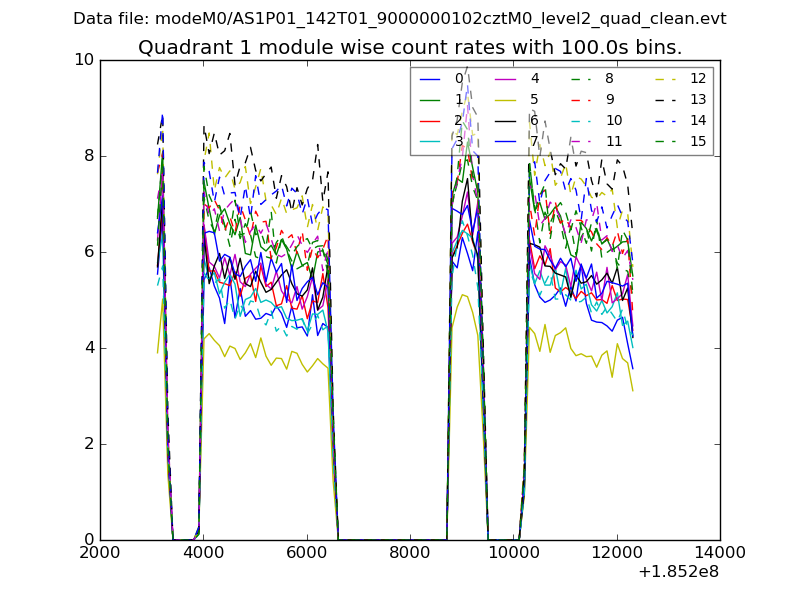
| Module-wise count rates for Quadrant B Data is divided into 100 sec bins |
 |
 |
| Module-wise count rates for Quadrant C Data is divided into 100 sec bins |
 |
 |
| Module-wise count rates for Quadrant D Data is divided into 100 sec bins |
 |
 |
| Parameter | Plot |
|---|---|
| CZT HV Monitor |  |
| D_VDD | 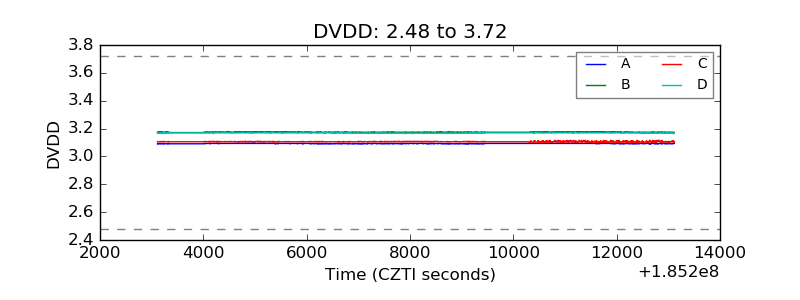 |
| Temperature 1 |  |
| Veto HV Monitor |  |
| Veto LLD | 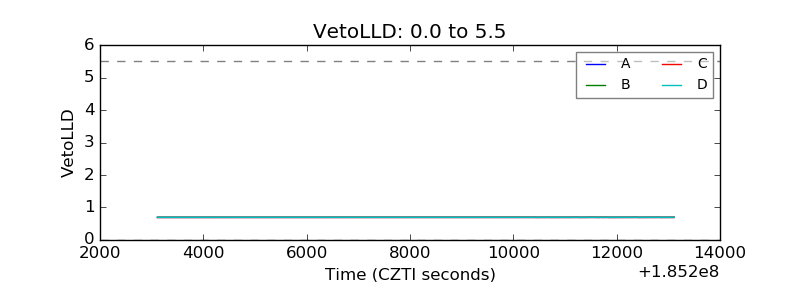 |
| Alpha Counter |  |
| _CPM_Rate |  |
| CZT Counter | 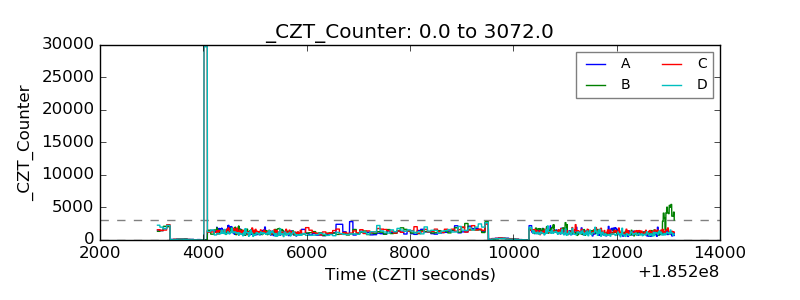 |
| +2.5 Volts monitor |  |
| +5 Volts monitor | 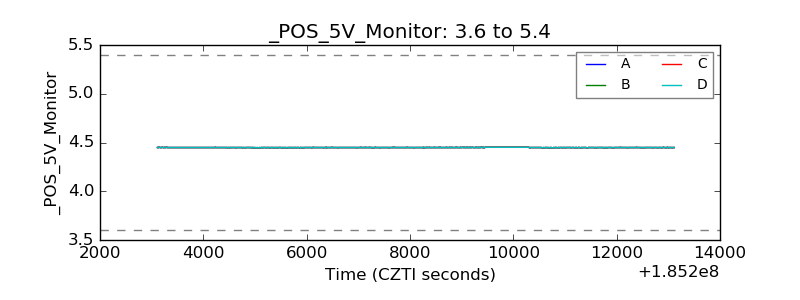 |
| _ROLL_ROT | 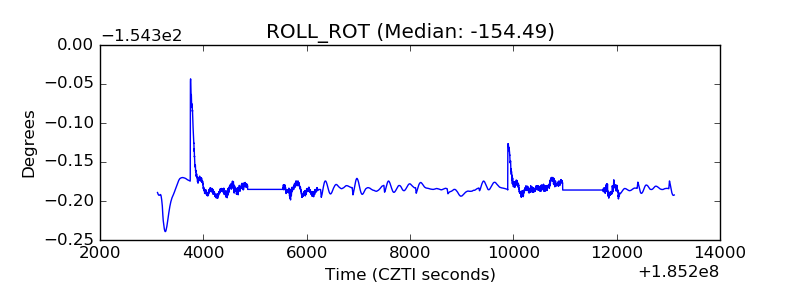 |
| _Roll_DEC |  |
| _Roll_RA |  |
| Veto Counter | 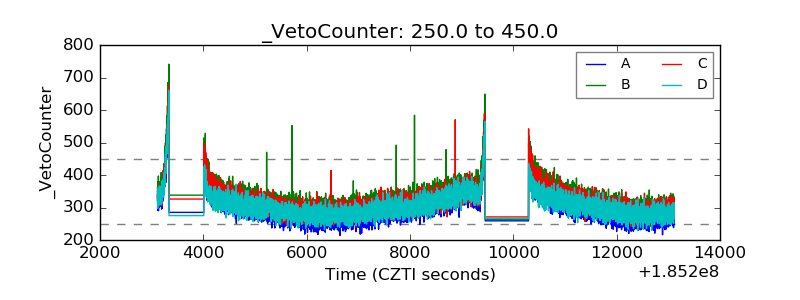 |