| Param | Original file | Final file |
|---|---|---|
| Filename | modeM0/AS1P01_141T01_9000000100cztM0_level2.evt | modeM0/AS1P01_141T01_9000000100cztM0_level2_quad_clean.evt |
| Size (bytes) | 5,205,571,200 | 339,647,040 |
| Size | 4.8 GB | 323.9 MB |
| Events in quadrant A | 35,175,423 | 2,135,162 |
| Events in quadrant B | 36,609,054 | 2,167,036 |
| Events in quadrant C | 41,966,680 | 2,089,120 |
| Events in quadrant D | 42,079,884 | 1,983,343 |
| Mode SS | |||
|---|---|---|---|
| Quadrant | BADHDUFLAG | Total packets | Discarded packets |
| A | 0 | 570 | 0 |
| B | 0 | 568 | 0 |
| C | 0 | 566 | 0 |
| D | 0 | 570 | 0 |
| Mode M9 | |||
|---|---|---|---|
| Quadrant | BADHDUFLAG | Total packets | Discarded packets |
| A | 0 | 15 | 0 |
| B | 0 | 15 | 0 |
| C | 0 | 15 | 0 |
| D | 0 | 15 | 0 |
| Mode M0 | |||
|---|---|---|---|
| Quadrant | BADHDUFLAG | Total packets | Discarded packets |
| A | 0 | 124260 | 0 |
| B | 0 | 128566 | 0 |
| C | 0 | 144299 | 0 |
| D | 0 | 144631 | 0 |
| Quadrant | Total seconds | Saturated seconds | Saturation percentage |
|---|---|---|---|
| A | 27852 | 408 | 1.464886% |
| B | 27808 | 490 | 1.762083% |
| C | 27771 | 511 | 1.840049% |
| D | 27773 | 616 | 2.217981% |
Noise dominated data is calculated using 1-second bins in cleaned event files. If a bin has >2000 counts, and if more than 50% of those come from <1% of pixels, then it is considered to be noise-dominated and hence unusable.
| Quadrant | # 1 sec bins | Bins with >0 counts | Bins with >2000 counts | High rate bins dominated by noise | Noise dominated (total time) | Noise dominated (detector-on time) | Marked lightcurve |
|---|---|---|---|---|---|---|---|
| A | 30021 | 28014 | 1805 | 1805 | 6.01% | 6.44% |  |
| B | 30021 | 27975 | 2006 | 2006 | 6.68% | 7.17% |  |
| C | 30021 | 27939 | 2818 | 2818 | 9.39% | 10.09% |  |
| D | 30021 | 27953 | 4803 | 4803 | 16.00% | 17.18% |  |
Top three noisy pixels from each quadrant. If the there are fewer than three noisy pixels in the level2.evt file, extra rows are filled as -1
| Pixel properties | Quadrant properties | ||||||
|---|---|---|---|---|---|---|---|
| Quadrant | DetID | PixID | Counts | Sigma | Mean | Median | Sigma |
| A | 15 | 69 | 534979 | 241.84 | 8907 | 8978 | 2175.0 |
| A | 10 | 216 | 440357 | 198.33 | 8907 | 8978 | 2175.0 |
| A | 11 | 79 | 34237 | 11.61 | 8907 | 8978 | 2175.0 |
| B | 7 | 221 | 982206 | 447.8 | 9175 | 9250 | 2172.7 |
| B | 5 | 191 | 300023 | 133.83 | 9175 | 9250 | 2172.7 |
| B | 0 | 220 | 207600 | 91.29 | 9175 | 9250 | 2172.7 |
| C | 3 | 95 | 1639588 | 692.76 | 8366 | 8678 | 2354.2 |
| C | 3 | 31 | 1567152 | 661.99 | 8366 | 8678 | 2354.2 |
| C | 3 | 127 | 1333852 | 562.89 | 8366 | 8678 | 2354.2 |
| D | 0 | 25 | 10067740 | 3983.14 | 8115 | 8425 | 2525.5 |
| D | 1 | 4 | 583189 | 227.59 | 8115 | 8425 | 2525.5 |
| D | 12 | 233 | 518812 | 202.1 | 8115 | 8425 | 2525.5 |
Histogram calculated using DETX and DETY for each event in the final _common_clean file
| Quadrant A |  |
 |
Quadrant B |
|---|---|---|---|
| Quadrant D |  |
 |
Quadrant C |
| Plot type | Count rate plots | Images |
|---|---|---|
| Comparison with Poisson distribution Blue bars denote a histogram of data divided into 1 sec bins. Red curve is a Poisson curve with rate = median count rate of data. |
 |
 |
| Quadrant-wise count rates Data is divided into 100 sec bins |
 |
|
| Module-wise count rates for Quadrant A Data is divided into 100 sec bins |
 |
 |
| Module-wise count rates for Quadrant B Data is divided into 100 sec bins |
 |
 |
| Module-wise count rates for Quadrant C Data is divided into 100 sec bins |
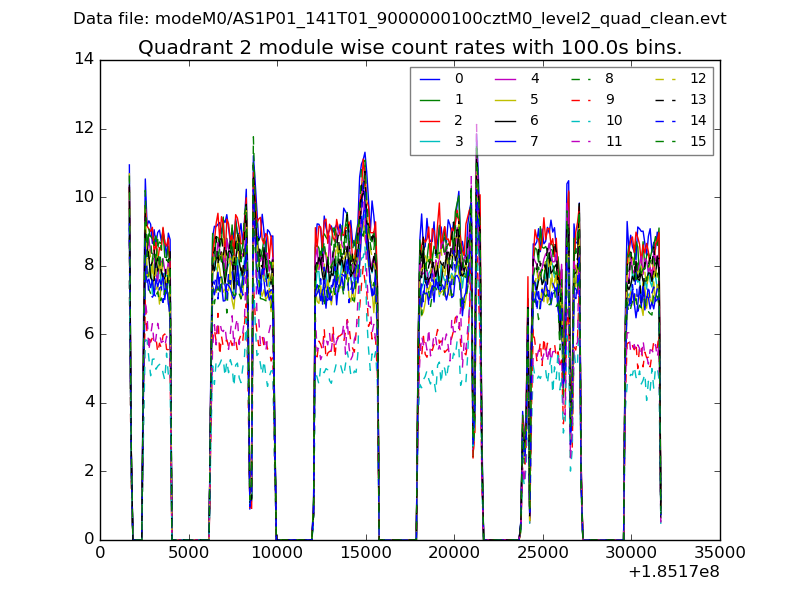 |
 |
| Module-wise count rates for Quadrant D Data is divided into 100 sec bins |
 |
 |
| Parameter | Plot |
|---|---|
| CZT HV Monitor |  |
| D_VDD |  |
| Temperature 1 |  |
| Veto HV Monitor |  |
| Veto LLD |  |
| Alpha Counter |  |
| _CPM_Rate |  |
| CZT Counter |  |
| +2.5 Volts monitor |  |
| +5 Volts monitor |  |
| _ROLL_ROT |  |
| _Roll_DEC |  |
| _Roll_RA |  |
| Veto Counter |  |