| Param | Original file | Final file |
|---|---|---|
| Filename | modeM0/AS1P01_141T01_9000000096cztM0_level2_bc.evt | modeM0/AS1P01_141T01_9000000096cztM0_level2_quad_clean.evt |
| Size (bytes) | 2,333,001,600 | 823,973,760 |
| Size | 2.2 GB | 785.8 MB |
| Events in quadrant A | 13,409,526 | 5,214,726 |
| Events in quadrant B | 16,217,044 | 5,317,347 |
| Events in quadrant C | 13,093,384 | 5,066,681 |
| Events in quadrant D | 23,502,793 | 4,899,608 |
| Mode M9 | |||
|---|---|---|---|
| Quadrant | BADHDUFLAG | Total packets | Discarded packets |
| A | 0 | 154 | 0 |
| B | 0 | 154 | 0 |
| C | 0 | 154 | 0 |
| D | 0 | 155 | 0 |
| Mode M0 | |||
|---|---|---|---|
| Quadrant | BADHDUFLAG | Total packets | Discarded packets |
| A | 0 | 310826 | 0 |
| B | 0 | 316153 | 0 |
| C | 0 | 282017 | 0 |
| D | 0 | 315263 | 0 |
| Mode SS | |||
|---|---|---|---|
| Quadrant | BADHDUFLAG | Total packets | Discarded packets |
| A | 0 | 719 | 0 |
| B | 0 | 719 | 0 |
| C | 0 | 719 | 0 |
| D | 0 | 719 | 0 |
| Quadrant | Total seconds | Saturated seconds | Saturation percentage |
|---|---|---|---|
| A | 70587 | 916 | 1.297689% |
| B | 70421 | 1030 | 1.462632% |
| C | 67219 | 1021 | 1.518916% |
| D | 69979 | 2782 | 3.975478% |
Noise dominated data is calculated using 1-second bins in cleaned event files. If a bin has >2000 counts, and if more than 50% of those come from <1% of pixels, then it is considered to be noise-dominated and hence unusable.
| Quadrant | # 1 sec bins | Bins with >0 counts | Bins with >2000 counts | High rate bins dominated by noise | Noise dominated (total time) | Noise dominated (detector-on time) | Marked lightcurve |
|---|---|---|---|---|---|---|---|
| A | 85624 | 70591 | 10 | 10 | 0.01% | 0.01% |  |
| B | 85624 | 70423 | 49 | 49 | 0.06% | 0.07% |  |
| C | 85624 | 67221 | 53 | 53 | 0.06% | 0.08% |  |
| D | 85624 | 69983 | 403 | 403 | 0.47% | 0.58% | 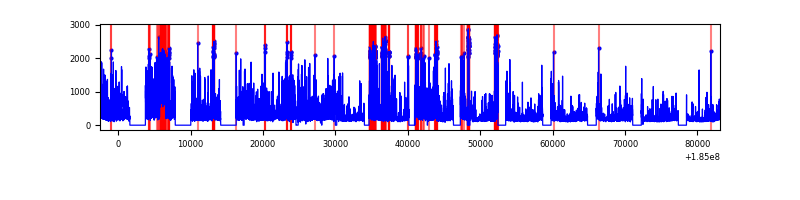 |
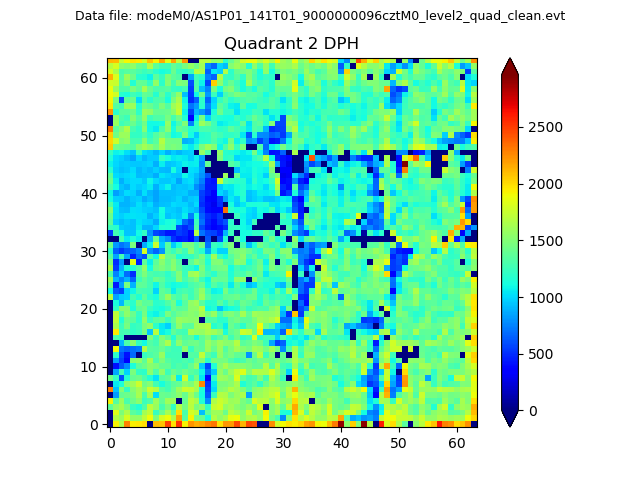
Top three noisy pixels from each quadrant. If the there are fewer than three noisy pixels in the level2.evt file, extra rows are filled as -1
| Pixel properties | Quadrant properties | ||||||
|---|---|---|---|---|---|---|---|
| Quadrant | DetID | PixID | Counts | Sigma | Mean | Median | Sigma |
| A | 14 | 79 | 140473 | 199.83 | 3225 | 3167 | 687.1 |
| A | 12 | 236 | 133955 | 190.34 | 3225 | 3167 | 687.1 |
| A | 0 | 238 | 117105 | 165.82 | 3225 | 3167 | 687.1 |
| B | 7 | 221 | 1334113 | 2153.07 | 3295 | 3221 | 618.1 |
| B | 0 | 220 | 796066 | 1282.64 | 3295 | 3221 | 618.1 |
| B | 5 | 191 | 289316 | 462.83 | 3295 | 3221 | 618.1 |
| C | 9 | 52 | 772001 | 1197.54 | 3044 | 3003 | 642.1 |
| C | 15 | 241 | 169928 | 259.95 | 3044 | 3003 | 642.1 |
| C | 2 | 192 | 83750 | 125.74 | 3044 | 3003 | 642.1 |
| D | 12 | 237 | 5832924 | 8399.96 | 3082 | 3013 | 694.0 |
| D | 1 | 4 | 1472693 | 2117.57 | 3082 | 3013 | 694.0 |
| D | 13 | 221 | 513770 | 735.92 | 3082 | 3013 | 694.0 |
Histogram calculated using DETX and DETY for each event in the final _common_clean file
| Quadrant A | 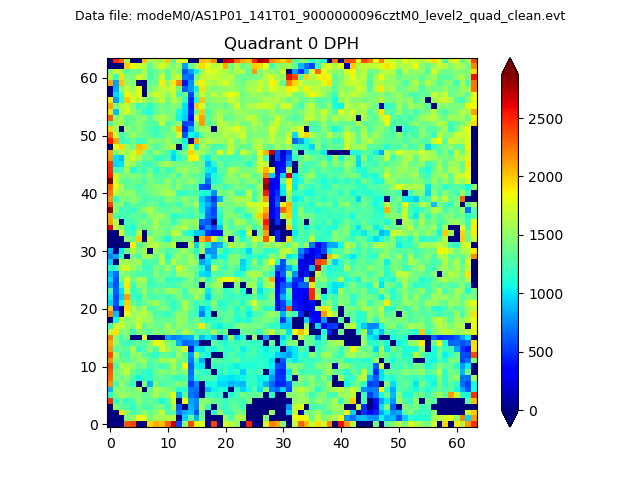 |
 |
Quadrant B |
|---|---|---|---|
| Quadrant D | 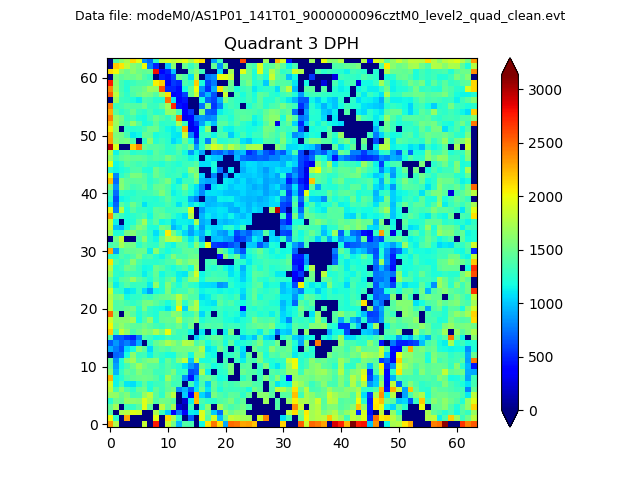 |
 |
Quadrant C |
| Plot type | Count rate plots | Images |
|---|---|---|
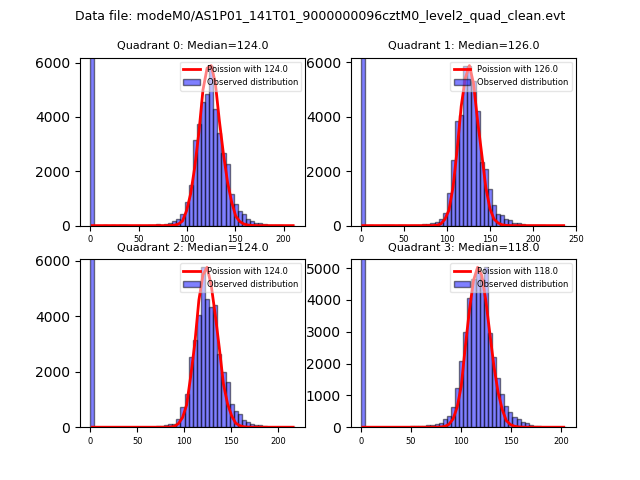
| Comparison with Poisson distribution Blue bars denote a histogram of data divided into 1 sec bins. Red curve is a Poisson curve with rate = median count rate of data. |
 |
 |
| Quadrant-wise count rates Data is divided into 100 sec bins |
 |
|
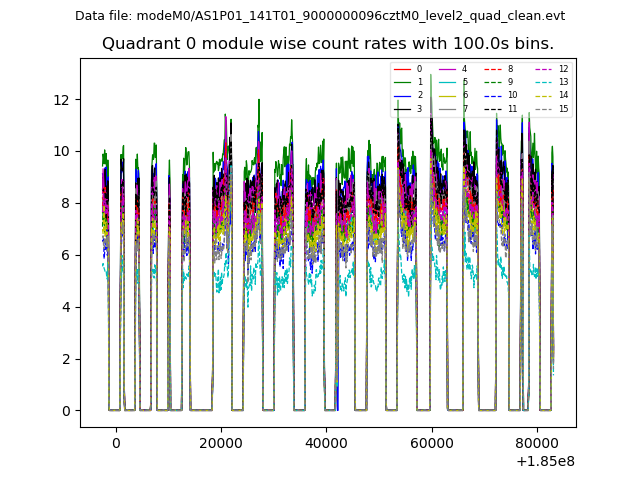
| Module-wise count rates for Quadrant A Data is divided into 100 sec bins |
 |
 |
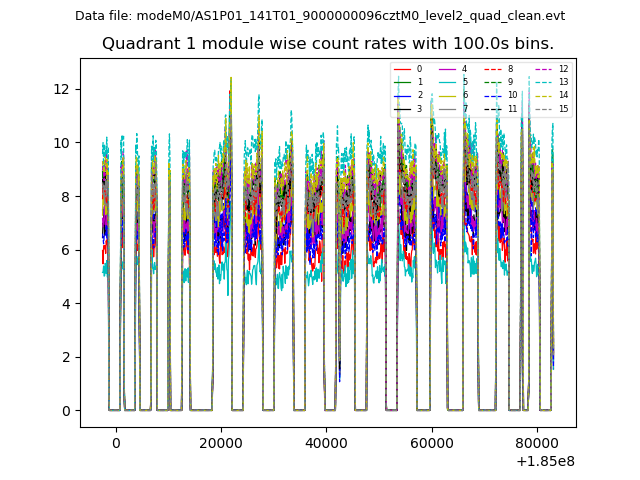
| Module-wise count rates for Quadrant B Data is divided into 100 sec bins |
 |
 |
| Module-wise count rates for Quadrant C Data is divided into 100 sec bins |
 |
 |
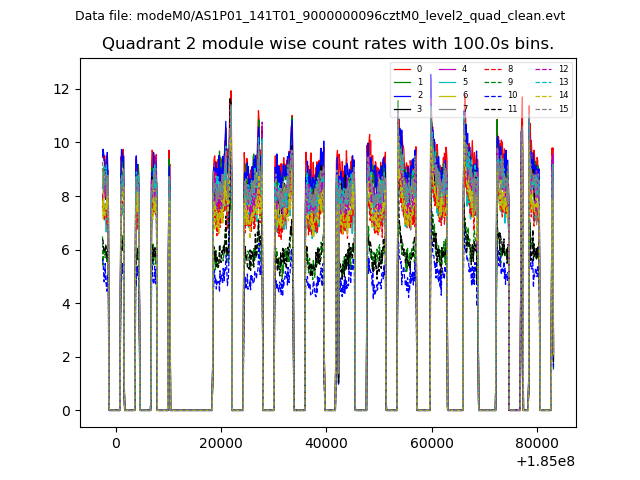
| Module-wise count rates for Quadrant D Data is divided into 100 sec bins |
 |
 |
| Parameter | Plot |
|---|---|
| CZT HV Monitor |  |
| D_VDD |  |
| Temperature 1 |  |
| Veto HV Monitor |  |
| Veto LLD | 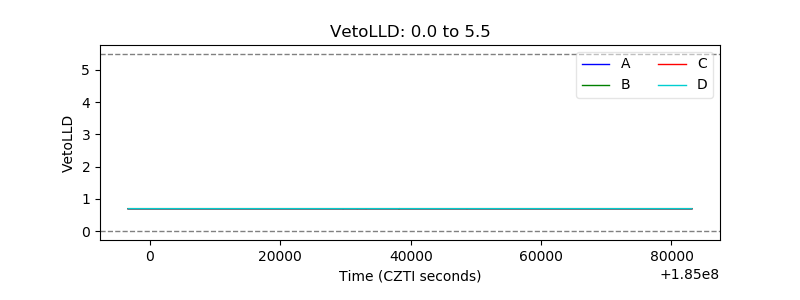 |
| Alpha Counter |  |
| _CPM_Rate | 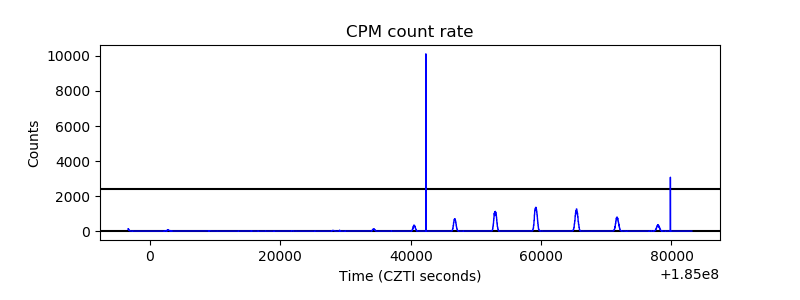 |
| CZT Counter | 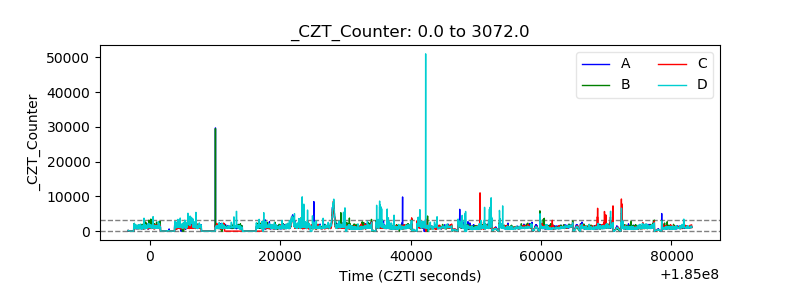 |
| +2.5 Volts monitor | 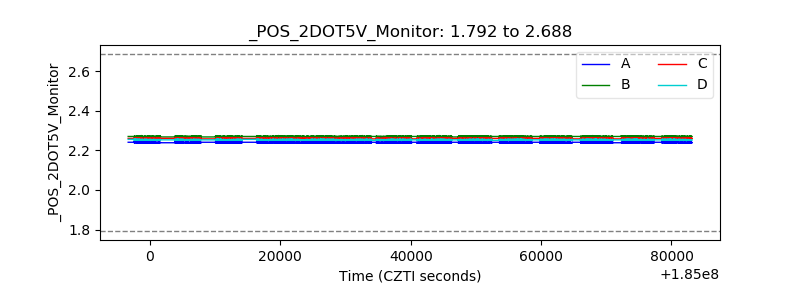 |
| +5 Volts monitor |  |
| _ROLL_ROT |  |
| _Roll_DEC |  |
| _Roll_RA | 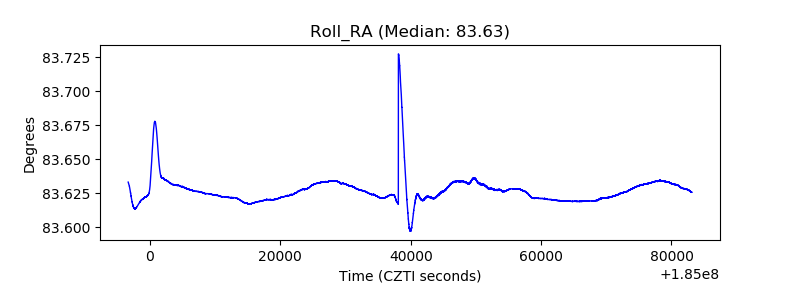 |
| Veto Counter | 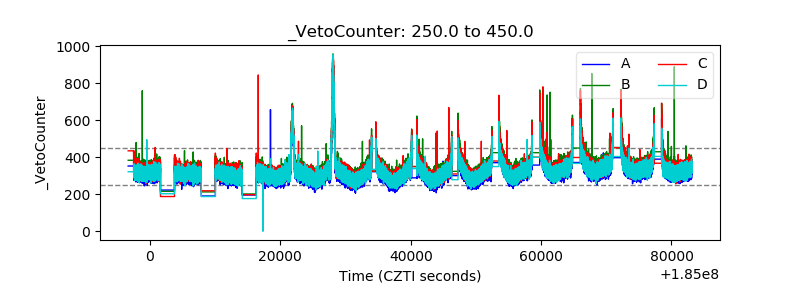 |