| Param | Original file | Final file |
|---|---|---|
| Filename | modeM0/AS1P01_124T01_9000000094cztM0_level2.evt | modeM0/AS1P01_124T01_9000000094cztM0_level2_quad_clean.evt |
| Size (bytes) | 6,651,155,520 | 479,592,000 |
| Size | 6.2 GB | 457.4 MB |
| Events in quadrant A | 49,593,408 | 2,939,736 |
| Events in quadrant B | 49,900,933 | 2,990,401 |
| Events in quadrant C | 45,497,779 | 2,927,700 |
| Events in quadrant D | 53,643,667 | 2,757,469 |
| Mode M9 | |||
|---|---|---|---|
| Quadrant | BADHDUFLAG | Total packets | Discarded packets |
| A | 0 | 216 | 0 |
| B | 0 | 216 | 0 |
| C | 0 | 216 | 0 |
| D | 0 | 216 | 0 |
| Mode SS | |||
|---|---|---|---|
| Quadrant | BADHDUFLAG | Total packets | Discarded packets |
| A | 0 | 868 | 0 |
| B | 0 | 868 | 0 |
| C | 0 | 868 | 0 |
| D | 0 | 868 | 0 |
| Mode M0 | |||
|---|---|---|---|
| Quadrant | BADHDUFLAG | Total packets | Discarded packets |
| A | 0 | 177519 | 0 |
| B | 0 | 178404 | 0 |
| C | 0 | 165342 | 0 |
| D | 0 | 189804 | 0 |
| Quadrant | Total seconds | Saturated seconds | Saturation percentage |
|---|---|---|---|
| A | 42390 | 165 | 0.389243% |
| B | 42390 | 223 | 0.526067% |
| C | 42390 | 330 | 0.778485% |
| D | 42390 | 1765 | 4.163718% |
Noise dominated data is calculated using 1-second bins in cleaned event files. If a bin has >2000 counts, and if more than 50% of those come from <1% of pixels, then it is considered to be noise-dominated and hence unusable.
| Quadrant | # 1 sec bins | Bins with >0 counts | Bins with >2000 counts | High rate bins dominated by noise | Noise dominated (total time) | Noise dominated (detector-on time) | Marked lightcurve |
|---|---|---|---|---|---|---|---|
| A | 63951 | 42400 | 1169 | 1169 | 1.83% | 2.76% |  |
| B | 63951 | 42400 | 1038 | 1038 | 1.62% | 2.45% |  |
| C | 63951 | 42400 | 643 | 643 | 1.01% | 1.52% |  |
| D | 63951 | 42400 | 3862 | 3862 | 6.04% | 9.11% |  |
Top three noisy pixels from each quadrant. If the there are fewer than three noisy pixels in the level2.evt file, extra rows are filled as -1
| Pixel properties | Quadrant properties | ||||||
|---|---|---|---|---|---|---|---|
| Quadrant | DetID | PixID | Counts | Sigma | Mean | Median | Sigma |
| A | 12 | 133 | 523552 | 189.6 | 12271 | 12135 | 2697.4 |
| A | 15 | 171 | 382010 | 137.12 | 12271 | 12135 | 2697.4 |
| A | 12 | 236 | 322579 | 115.09 | 12271 | 12135 | 2697.4 |
| B | 5 | 191 | 537672 | 181.71 | 12353 | 12415 | 2890.6 |
| B | 7 | 221 | 462931 | 155.85 | 12353 | 12415 | 2890.6 |
| B | 4 | 172 | 448305 | 150.79 | 12353 | 12415 | 2890.6 |
| C | 9 | 83 | 750767 | 237.08 | 11203 | 11594 | 3117.8 |
| C | 9 | 52 | 471084 | 147.38 | 11203 | 11594 | 3117.8 |
| C | 3 | 159 | 125393 | 36.5 | 11203 | 11594 | 3117.8 |
| D | 1 | 4 | 6400739 | 1907.46 | 10696 | 11097 | 3349.8 |
| D | 13 | 221 | 1786767 | 530.08 | 10696 | 11097 | 3349.8 |
| D | 13 | 216 | 943573 | 278.37 | 10696 | 11097 | 3349.8 |
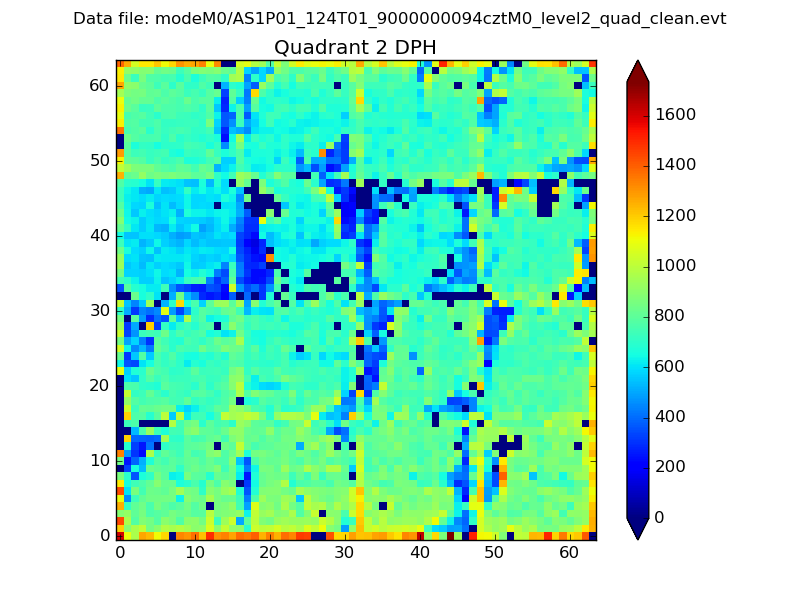
Histogram calculated using DETX and DETY for each event in the final _common_clean file
| Quadrant A |  |
 |
Quadrant B |
|---|---|---|---|
| Quadrant D |  |
 |
Quadrant C |
| Plot type | Count rate plots | Images |
|---|---|---|
| Comparison with Poisson distribution Blue bars denote a histogram of data divided into 1 sec bins. Red curve is a Poisson curve with rate = median count rate of data. |
 |
 |
| Quadrant-wise count rates Data is divided into 100 sec bins |
 |
|
| Module-wise count rates for Quadrant A Data is divided into 100 sec bins |
 |
 |
| Module-wise count rates for Quadrant B Data is divided into 100 sec bins |
 |
 |
| Module-wise count rates for Quadrant C Data is divided into 100 sec bins |
 |
 |
| Module-wise count rates for Quadrant D Data is divided into 100 sec bins |
 |
 |
| Parameter | Plot |
|---|---|
| CZT HV Monitor |  |
| D_VDD | 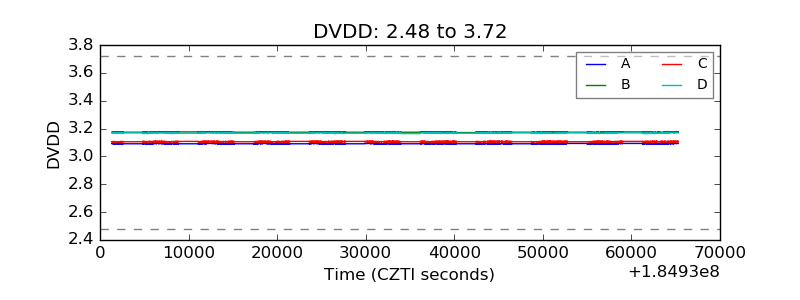 |
| Temperature 1 | 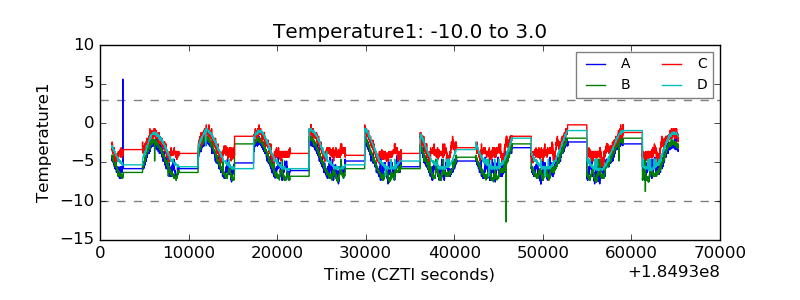 |
| Veto HV Monitor |  |
| Veto LLD |  |
| Alpha Counter |  |
| _CPM_Rate |  |
| CZT Counter | 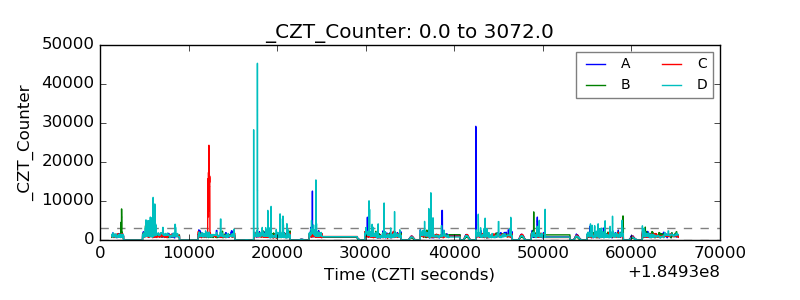 |
| +2.5 Volts monitor |  |
| +5 Volts monitor | 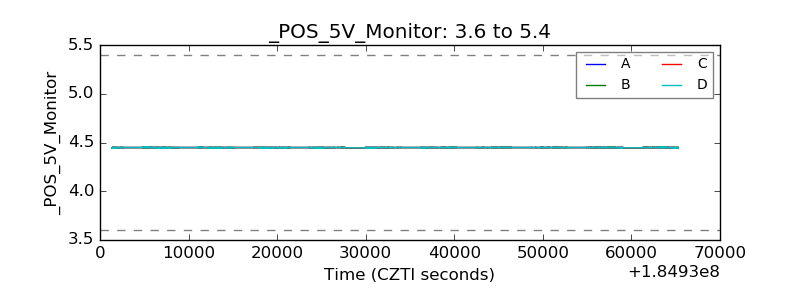 |
| _ROLL_ROT |  |
| _Roll_DEC | 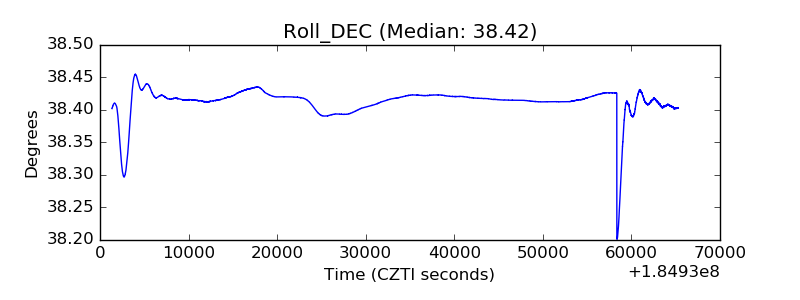 |
| _Roll_RA |  |
| Veto Counter |  |