| Param | Original file | Final file |
|---|---|---|
| Filename | modeM0/AS1P01_127T01_9000000090cztM0_level2_bc.evt | modeM0/AS1P01_127T01_9000000090cztM0_level2_quad_clean.evt |
| Size (bytes) | 241,035,840 | 107,714,880 |
| Size | 229.9 MB | 102.7 MB |
| Events in quadrant A | 1,264,159 | 699,415 |
| Events in quadrant B | 1,433,261 | 697,689 |
| Events in quadrant C | 1,220,398 | 705,782 |
| Events in quadrant D | 2,886,194 | 660,654 |
| Mode M9 | |||
|---|---|---|---|
| Quadrant | BADHDUFLAG | Total packets | Discarded packets |
| A | 0 | 30 | 0 |
| B | 0 | 30 | 0 |
| C | 0 | 30 | 0 |
| D | 0 | 30 | 0 |
| Mode SS | |||
|---|---|---|---|
| Quadrant | BADHDUFLAG | Total packets | Discarded packets |
| A | 0 | 144 | 0 |
| B | 0 | 144 | 0 |
| C | 0 | 144 | 0 |
| D | 0 | 144 | 0 |
| Mode M0 | |||
|---|---|---|---|
| Quadrant | BADHDUFLAG | Total packets | Discarded packets |
| A | 0 | 28956 | 0 |
| B | 0 | 29536 | 0 |
| C | 0 | 27884 | 0 |
| D | 0 | 32985 | 0 |
| Quadrant | Total seconds | Saturated seconds | Saturation percentage |
|---|---|---|---|
| A | 7166 | 7 | 0.097684% |
| B | 7166 | 43 | 0.600056% |
| C | 7166 | 3 | 0.041864% |
| D | 7165 | 310 | 4.326588% |
Noise dominated data is calculated using 1-second bins in cleaned event files. If a bin has >2000 counts, and if more than 50% of those come from <1% of pixels, then it is considered to be noise-dominated and hence unusable.
| Quadrant | # 1 sec bins | Bins with >0 counts | Bins with >2000 counts | High rate bins dominated by noise | Noise dominated (total time) | Noise dominated (detector-on time) | Marked lightcurve |
|---|---|---|---|---|---|---|---|
| A | 14612 | 7165 | 0 | 0 | 0.00% | 0.00% |  |
| B | 14612 | 7165 | 2 | 2 | 0.01% | 0.03% |  |
| C | 14612 | 7165 | 0 | 0 | 0.00% | 0.00% | 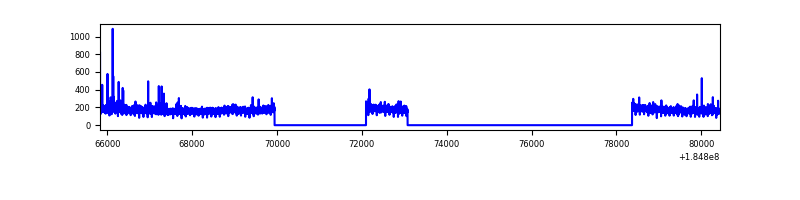 |
| D | 14612 | 7164 | 53 | 53 | 0.36% | 0.74% |  |
Top three noisy pixels from each quadrant. If the there are fewer than three noisy pixels in the level2.evt file, extra rows are filled as -1
| Pixel properties | Quadrant properties | ||||||
|---|---|---|---|---|---|---|---|
| Quadrant | DetID | PixID | Counts | Sigma | Mean | Median | Sigma |
| A | 0 | 238 | 38743 | 593.02 | 296 | 290 | 64.8 |
| A | 0 | 69 | 17691 | 268.36 | 296 | 290 | 64.8 |
| A | 13 | 160 | 13207 | 199.2 | 296 | 290 | 64.8 |
| B | 0 | 220 | 78778 | 1391.64 | 298 | 290 | 56.4 |
| B | 5 | 249 | 40377 | 710.77 | 298 | 290 | 56.4 |
| B | 5 | 191 | 34592 | 608.2 | 298 | 290 | 56.4 |
| C | 15 | 241 | 9775 | 144.82 | 296 | 291 | 65.5 |
| C | 5 | 17 | 6559 | 95.71 | 296 | 291 | 65.5 |
| C | 10 | 17 | 6346 | 92.46 | 296 | 291 | 65.5 |
| D | 1 | 4 | 672393 | 10357.44 | 287 | 279 | 64.9 |
| D | 13 | 221 | 185695 | 2857.31 | 287 | 279 | 64.9 |
| D | 13 | 216 | 166195 | 2556.81 | 287 | 279 | 64.9 |
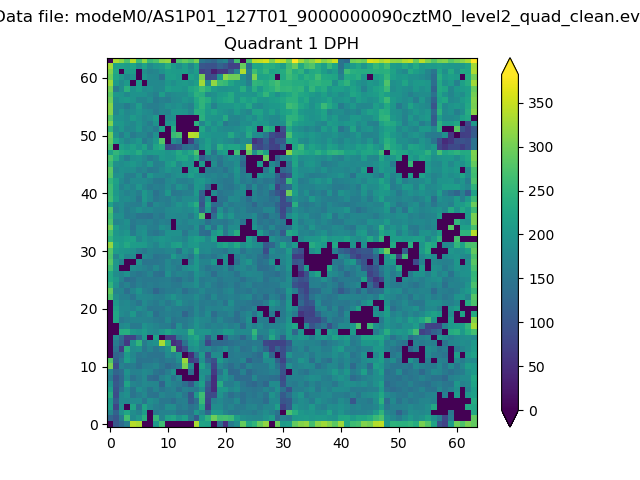
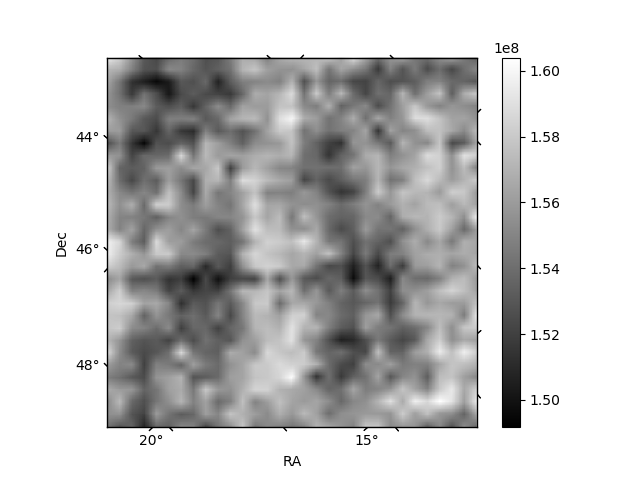
Histogram calculated using DETX and DETY for each event in the final _common_clean file
| Quadrant A |  |
 |
Quadrant B |
|---|---|---|---|
| Quadrant D |  |
 |
Quadrant C |
| Plot type | Count rate plots | Images |
|---|---|---|
| Comparison with Poisson distribution Blue bars denote a histogram of data divided into 1 sec bins. Red curve is a Poisson curve with rate = median count rate of data. |
 |
 |
| Quadrant-wise count rates Data is divided into 100 sec bins |
 |
|
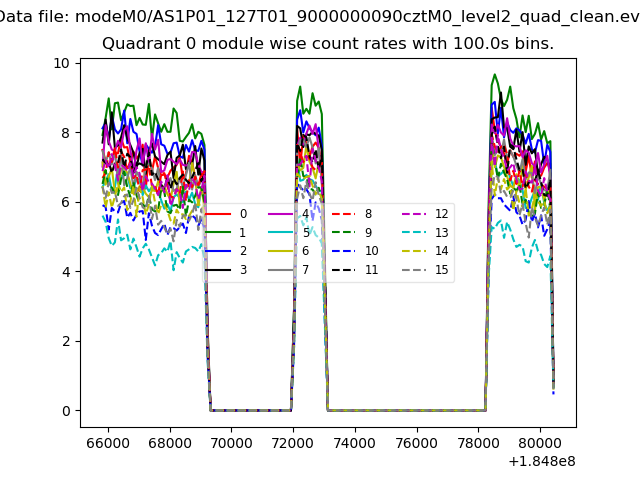
| Module-wise count rates for Quadrant A Data is divided into 100 sec bins |
 |
 |
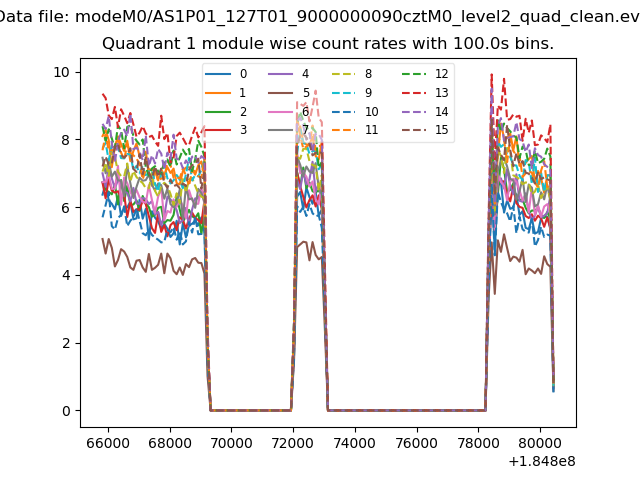
| Module-wise count rates for Quadrant B Data is divided into 100 sec bins |
 |
 |
| Module-wise count rates for Quadrant C Data is divided into 100 sec bins |
 |
 |
| Module-wise count rates for Quadrant D Data is divided into 100 sec bins |
 |
 |
| Parameter | Plot |
|---|---|
| CZT HV Monitor |  |
| D_VDD |  |
| Temperature 1 |  |
| Veto HV Monitor |  |
| Veto LLD |  |
| Alpha Counter |  |
| _CPM_Rate |  |
| CZT Counter |  |
| +2.5 Volts monitor | 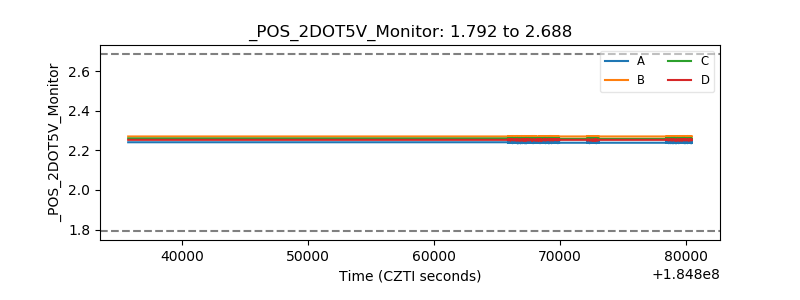 |
| +5 Volts monitor |  |
| _ROLL_ROT |  |
| _Roll_DEC |  |
| _Roll_RA |  |
| Veto Counter |  |