| Param | Original file | Final file |
|---|---|---|
| Filename | modeM0/AS1P01_126T04_9000000092cztM0_level2_bc.evt | modeM0/AS1P01_126T04_9000000092cztM0_level2_quad_clean.evt |
| Size (bytes) | 1,015,341,120 | 288,757,440 |
| Size | 968.3 MB | 275.4 MB |
| Events in quadrant A | 6,112,324 | 1,625,375 |
| Events in quadrant B | 6,903,307 | 1,659,968 |
| Events in quadrant C | 5,809,691 | 1,659,384 |
| Events in quadrant D | 9,713,937 | 1,577,176 |
| Mode M9 | |||
|---|---|---|---|
| Quadrant | BADHDUFLAG | Total packets | Discarded packets |
| A | 0 | 172 | 0 |
| B | 0 | 172 | 0 |
| C | 0 | 172 | 0 |
| D | 0 | 172 | 0 |
| Mode M0 | |||
|---|---|---|---|
| Quadrant | BADHDUFLAG | Total packets | Discarded packets |
| A | 0 | 138744 | 0 |
| B | 0 | 140020 | 0 |
| C | 0 | 127551 | 0 |
| D | 0 | 136231 | 0 |
| Mode SS | |||
|---|---|---|---|
| Quadrant | BADHDUFLAG | Total packets | Discarded packets |
| A | 0 | 664 | 0 |
| B | 0 | 664 | 0 |
| C | 0 | 664 | 0 |
| D | 0 | 664 | 0 |
| Quadrant | Total seconds | Saturated seconds | Saturation percentage |
|---|---|---|---|
| A | 32348 | 77 | 0.238036% |
| B | 32348 | 80 | 0.247310% |
| C | 32348 | 22 | 0.068010% |
| D | 32348 | 500 | 1.545691% |
Noise dominated data is calculated using 1-second bins in cleaned event files. If a bin has >2000 counts, and if more than 50% of those come from <1% of pixels, then it is considered to be noise-dominated and hence unusable.
| Quadrant | # 1 sec bins | Bins with >0 counts | Bins with >2000 counts | High rate bins dominated by noise | Noise dominated (total time) | Noise dominated (detector-on time) | Marked lightcurve |
|---|---|---|---|---|---|---|---|
| A | 49590 | 32348 | 6 | 6 | 0.01% | 0.02% |  |
| B | 49590 | 32348 | 5 | 5 | 0.01% | 0.02% | 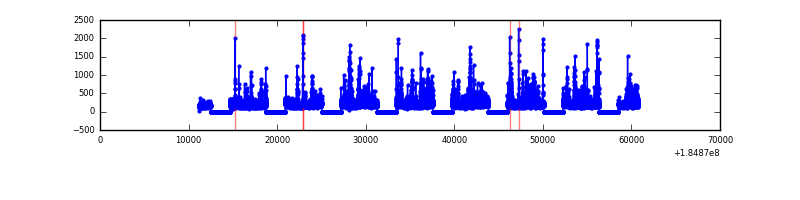 |
| C | 49590 | 32349 | 12 | 12 | 0.02% | 0.04% |  |
| D | 49590 | 32348 | 90 | 90 | 0.18% | 0.28% |  |
Top three noisy pixels from each quadrant. If the there are fewer than three noisy pixels in the level2.evt file, extra rows are filled as -1
| Pixel properties | Quadrant properties | ||||||
|---|---|---|---|---|---|---|---|
| Quadrant | DetID | PixID | Counts | Sigma | Mean | Median | Sigma |
| A | 0 | 69 | 192949 | 674.1 | 1369 | 1340 | 284.2 |
| A | 0 | 238 | 175040 | 611.09 | 1369 | 1340 | 284.2 |
| A | 14 | 79 | 130215 | 453.39 | 1369 | 1340 | 284.2 |
| B | 7 | 221 | 450913 | 1816.23 | 1413 | 1370 | 247.5 |
| B | 4 | 172 | 231530 | 929.89 | 1413 | 1370 | 247.5 |
| B | 5 | 191 | 183768 | 736.92 | 1413 | 1370 | 247.5 |
| C | 9 | 52 | 120131 | 414.23 | 1376 | 1353 | 286.7 |
| C | 10 | 117 | 67614 | 231.08 | 1376 | 1353 | 286.7 |
| C | 15 | 241 | 43582 | 147.27 | 1376 | 1353 | 286.7 |
| D | 1 | 4 | 1399497 | 4725.55 | 1344 | 1303 | 295.9 |
| D | 12 | 237 | 756794 | 2553.37 | 1344 | 1303 | 295.9 |
| D | 13 | 221 | 336259 | 1132.07 | 1344 | 1303 | 295.9 |
Histogram calculated using DETX and DETY for each event in the final _common_clean file
| Quadrant A |  |
 |
Quadrant B |
|---|---|---|---|
| Quadrant D |  |
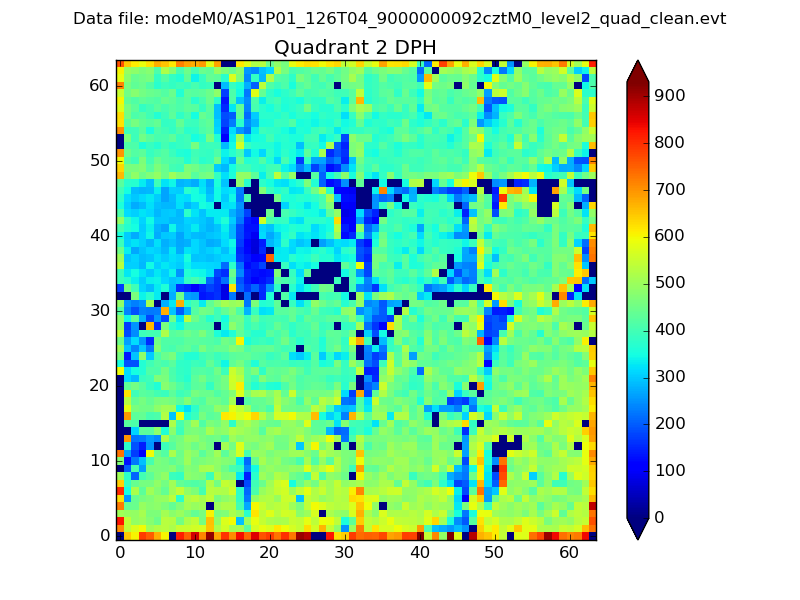 |
Quadrant C |
| Plot type | Count rate plots | Images |
|---|---|---|
| Comparison with Poisson distribution Blue bars denote a histogram of data divided into 1 sec bins. Red curve is a Poisson curve with rate = median count rate of data. |
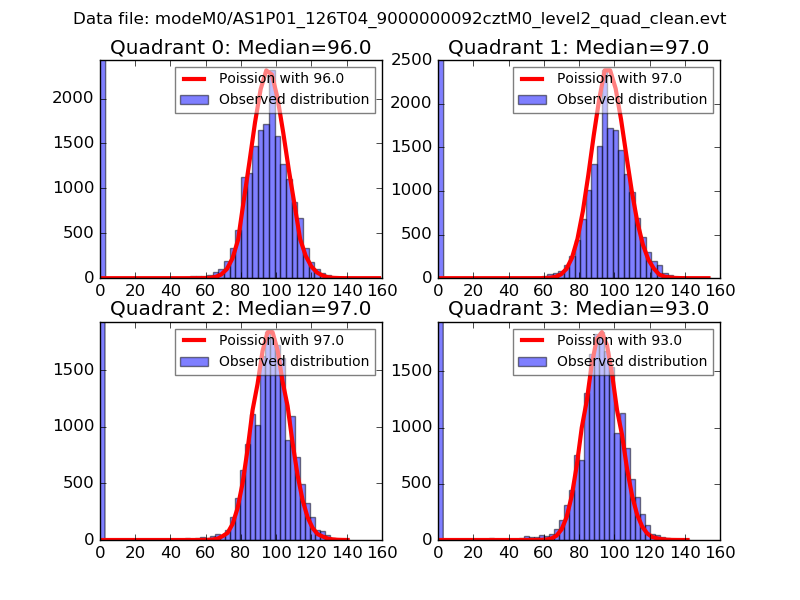 |
 |
| Quadrant-wise count rates Data is divided into 100 sec bins |
 |
|
| Module-wise count rates for Quadrant A Data is divided into 100 sec bins |
 |
 |
| Module-wise count rates for Quadrant B Data is divided into 100 sec bins |
 |
 |
| Module-wise count rates for Quadrant C Data is divided into 100 sec bins |
 |
 |
| Module-wise count rates for Quadrant D Data is divided into 100 sec bins |
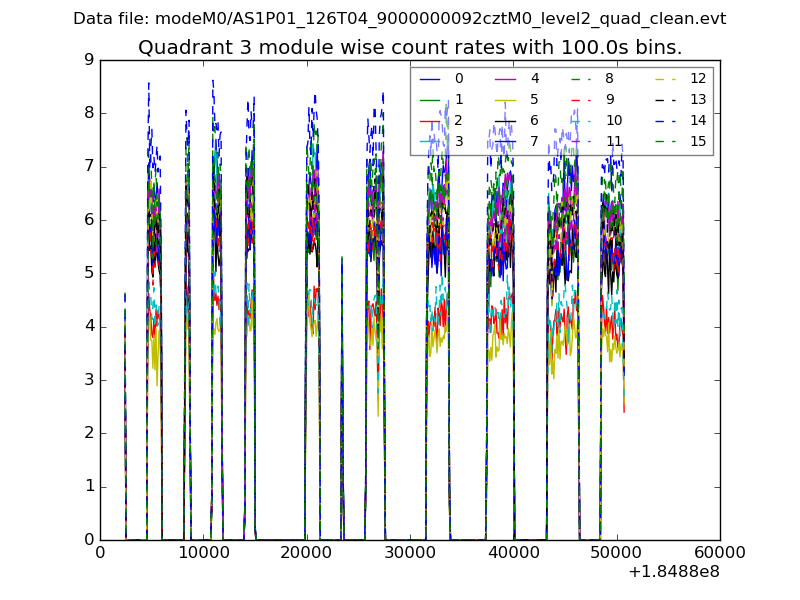 |
 |
| Parameter | Plot |
|---|---|
| CZT HV Monitor |  |
| D_VDD |  |
| Temperature 1 |  |
| Veto HV Monitor |  |
| Veto LLD |  |
| Alpha Counter | 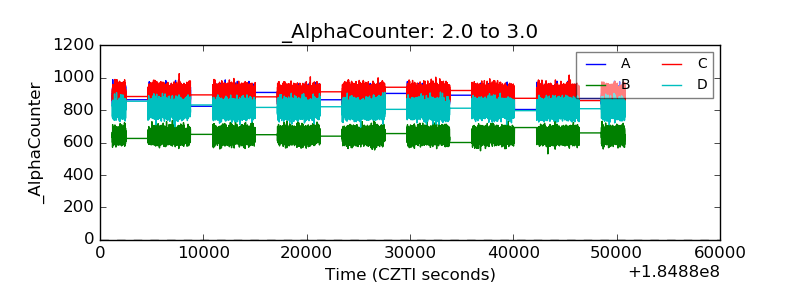 |
| _CPM_Rate | 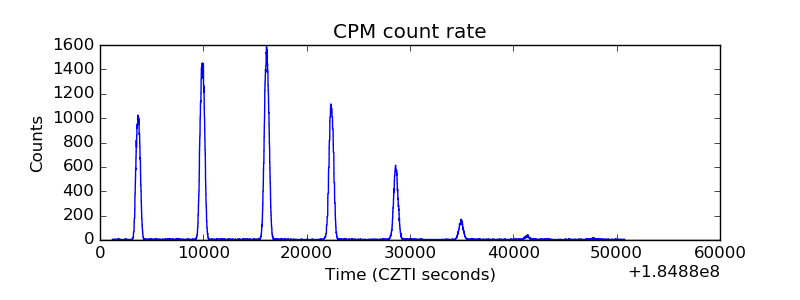 |
| CZT Counter |  |
| +2.5 Volts monitor |  |
| +5 Volts monitor |  |
| _ROLL_ROT |  |
| _Roll_DEC | 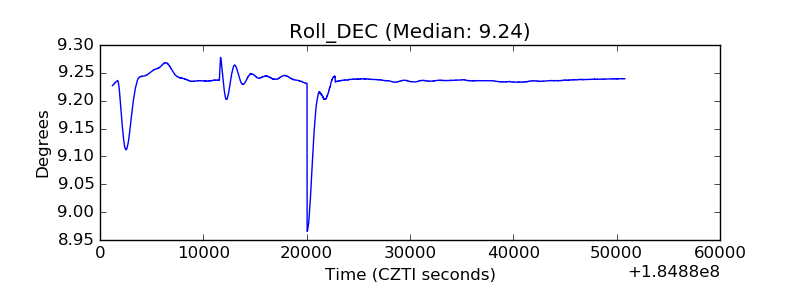 |
| _Roll_RA |  |
| Veto Counter |  |