| Param | Original file | Final file |
|---|---|---|
| Filename | modeM0/AS1P01_126T03_9000000088cztM0_level2_bc.evt | modeM0/AS1P01_126T03_9000000088cztM0_level2_quad_clean.evt |
| Size (bytes) | 943,058,880 | 290,191,680 |
| Size | 899.4 MB | 276.7 MB |
| Events in quadrant A | 6,287,809 | 1,696,117 |
| Events in quadrant B | 5,651,319 | 1,751,235 |
| Events in quadrant C | 5,413,191 | 1,703,505 |
| Events in quadrant D | 9,221,235 | 1,639,207 |
| Mode M0 | |||
|---|---|---|---|
| Quadrant | BADHDUFLAG | Total packets | Discarded packets |
| A | 0 | 125212 | 0 |
| B | 0 | 120465 | 0 |
| C | 0 | 113604 | 0 |
| D | 0 | 121835 | 0 |
| Mode SS | |||
|---|---|---|---|
| Quadrant | BADHDUFLAG | Total packets | Discarded packets |
| A | 0 | 594 | 0 |
| B | 0 | 594 | 0 |
| C | 0 | 594 | 0 |
| D | 0 | 594 | 0 |
| Mode M9 | |||
|---|---|---|---|
| Quadrant | BADHDUFLAG | Total packets | Discarded packets |
| A | 0 | 168 | 0 |
| B | 0 | 168 | 0 |
| C | 0 | 168 | 0 |
| D | 0 | 168 | 0 |
| Quadrant | Total seconds | Saturated seconds | Saturation percentage |
|---|---|---|---|
| A | 29081 | 180 | 0.618961% |
| B | 29081 | 33 | 0.113476% |
| C | 29081 | 130 | 0.447027% |
| D | 29081 | 534 | 1.836250% |
Noise dominated data is calculated using 1-second bins in cleaned event files. If a bin has >2000 counts, and if more than 50% of those come from <1% of pixels, then it is considered to be noise-dominated and hence unusable.
| Quadrant | # 1 sec bins | Bins with >0 counts | Bins with >2000 counts | High rate bins dominated by noise | Noise dominated (total time) | Noise dominated (detector-on time) | Marked lightcurve |
|---|---|---|---|---|---|---|---|
| A | 44020 | 29079 | 12 | 12 | 0.03% | 0.04% |  |
| B | 44020 | 29079 | 8 | 8 | 0.02% | 0.03% |  |
| C | 44020 | 29079 | 19 | 19 | 0.04% | 0.07% |  |
| D | 44020 | 29078 | 242 | 242 | 0.55% | 0.83% |  |
Top three noisy pixels from each quadrant. If the there are fewer than three noisy pixels in the level2.evt file, extra rows are filled as -1
| Pixel properties | Quadrant properties | ||||||
|---|---|---|---|---|---|---|---|
| Quadrant | DetID | PixID | Counts | Sigma | Mean | Median | Sigma |
| A | 12 | 133 | 509213 | 1978.78 | 1244 | 1218 | 256.7 |
| A | 0 | 238 | 216358 | 838.03 | 1244 | 1218 | 256.7 |
| A | 14 | 79 | 202894 | 785.58 | 1244 | 1218 | 256.7 |
| B | 7 | 221 | 188783 | 824.92 | 1287 | 1247 | 227.3 |
| B | 5 | 191 | 116001 | 504.77 | 1287 | 1247 | 227.3 |
| B | 0 | 220 | 55916 | 240.47 | 1287 | 1247 | 227.3 |
| C | 9 | 52 | 299752 | 1161.82 | 1234 | 1210 | 257.0 |
| C | 15 | 241 | 69083 | 264.14 | 1234 | 1210 | 257.0 |
| C | 3 | 159 | 66196 | 252.9 | 1234 | 1210 | 257.0 |
| D | 12 | 237 | 1861143 | 7159.31 | 1210 | 1176 | 259.8 |
| D | 1 | 4 | 951515 | 3658.01 | 1210 | 1176 | 259.8 |
| D | 13 | 216 | 416030 | 1596.84 | 1210 | 1176 | 259.8 |
Histogram calculated using DETX and DETY for each event in the final _common_clean file
| Quadrant A |  |
 |
Quadrant B |
|---|---|---|---|
| Quadrant D |  |
 |
Quadrant C |
| Plot type | Count rate plots | Images |
|---|---|---|
| Comparison with Poisson distribution Blue bars denote a histogram of data divided into 1 sec bins. Red curve is a Poisson curve with rate = median count rate of data. |
 |
 |
| Quadrant-wise count rates Data is divided into 100 sec bins |
 |
|
| Module-wise count rates for Quadrant A Data is divided into 100 sec bins |
 |
 |
| Module-wise count rates for Quadrant B Data is divided into 100 sec bins |
 |
 |
| Module-wise count rates for Quadrant C Data is divided into 100 sec bins |
 |
 |
| Module-wise count rates for Quadrant D Data is divided into 100 sec bins |
 |
 |
| Parameter | Plot |
|---|---|
| CZT HV Monitor |  |
| D_VDD |  |
| Temperature 1 |  |
| Veto HV Monitor |  |
| Veto LLD |  |
| Alpha Counter |  |
| _CPM_Rate |  |
| CZT Counter |  |
| +2.5 Volts monitor | 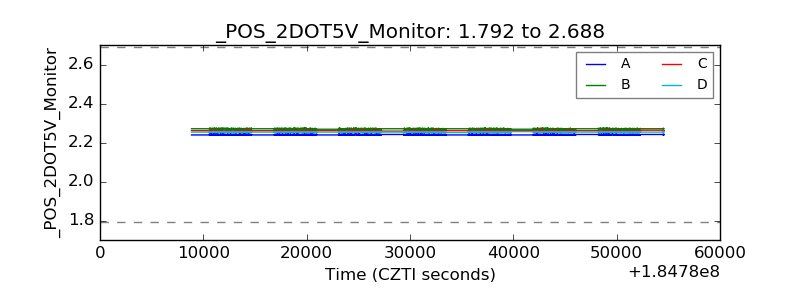 |
| +5 Volts monitor |  |
| _ROLL_ROT |  |
| _Roll_DEC |  |
| _Roll_RA |  |
| Veto Counter |  |