| Param | Original file | Final file |
|---|---|---|
| Filename | modeM0/AS1P01_116T01_9000000086cztM0_level2_bc.evt | modeM0/AS1P01_116T01_9000000086cztM0_level2_quad_clean.evt |
| Size (bytes) | 2,142,155,520 | 814,875,840 |
| Size | 2.0 GB | 777.1 MB |
| Events in quadrant A | 13,434,700 | 5,098,520 |
| Events in quadrant B | 13,859,276 | 5,170,460 |
| Events in quadrant C | 11,882,365 | 5,127,894 |
| Events in quadrant D | 21,284,723 | 4,845,219 |
| Mode M0 | |||
|---|---|---|---|
| Quadrant | BADHDUFLAG | Total packets | Discarded packets |
| A | 0 | 275533 | 0 |
| B | 0 | 276560 | 0 |
| C | 0 | 254065 | 0 |
| D | 0 | 276117 | 0 |
| Mode M9 | |||
|---|---|---|---|
| Quadrant | BADHDUFLAG | Total packets | Discarded packets |
| A | 0 | 334 | 0 |
| B | 0 | 335 | 0 |
| C | 0 | 334 | 0 |
| D | 0 | 334 | 0 |
| Mode SS | |||
|---|---|---|---|
| Quadrant | BADHDUFLAG | Total packets | Discarded packets |
| A | 0 | 1340 | 0 |
| B | 0 | 1330 | 0 |
| C | 0 | 1322 | 0 |
| D | 0 | 1336 | 0 |
| Quadrant | Total seconds | Saturated seconds | Saturation percentage |
|---|---|---|---|
| A | 64700 | 431 | 0.666151% |
| B | 64733 | 420 | 0.648819% |
| C | 64787 | 171 | 0.263942% |
| D | 64582 | 2037 | 3.154130% |
Noise dominated data is calculated using 1-second bins in cleaned event files. If a bin has >2000 counts, and if more than 50% of those come from <1% of pixels, then it is considered to be noise-dominated and hence unusable.
| Quadrant | # 1 sec bins | Bins with >0 counts | Bins with >2000 counts | High rate bins dominated by noise | Noise dominated (total time) | Noise dominated (detector-on time) | Marked lightcurve |
|---|---|---|---|---|---|---|---|
| A | 103811 | 65011 | 113 | 113 | 0.11% | 0.17% |  |
| B | 103811 | 65049 | 55 | 55 | 0.05% | 0.08% |  |
| C | 103811 | 65152 | 109 | 109 | 0.10% | 0.17% |  |
| D | 103811 | 64778 | 897 | 897 | 0.86% | 1.38% |  |
Top three noisy pixels from each quadrant. If the there are fewer than three noisy pixels in the level2.evt file, extra rows are filled as -1
| Pixel properties | Quadrant properties | ||||||
|---|---|---|---|---|---|---|---|
| Quadrant | DetID | PixID | Counts | Sigma | Mean | Median | Sigma |
| A | 0 | 69 | 1110808 | 1978.72 | 2661 | 2605 | 560.1 |
| A | 0 | 238 | 516631 | 917.81 | 2661 | 2605 | 560.1 |
| A | 15 | 171 | 409281 | 726.13 | 2661 | 2605 | 560.1 |
| B | 5 | 191 | 777906 | 1602.23 | 2741 | 2665 | 483.9 |
| B | 0 | 220 | 649446 | 1336.73 | 2741 | 2665 | 483.9 |
| B | 7 | 221 | 628396 | 1293.23 | 2741 | 2665 | 483.9 |
| C | 15 | 241 | 427216 | 745.36 | 2672 | 2620 | 569.7 |
| C | 9 | 83 | 316904 | 551.71 | 2672 | 2620 | 569.7 |
| C | 9 | 52 | 254191 | 441.62 | 2672 | 2620 | 569.7 |
| D | 1 | 4 | 2496300 | 4349.01 | 2590 | 2523 | 573.4 |
| D | 13 | 25 | 2264216 | 3944.27 | 2590 | 2523 | 573.4 |
| D | 12 | 237 | 1784906 | 3108.38 | 2590 | 2523 | 573.4 |
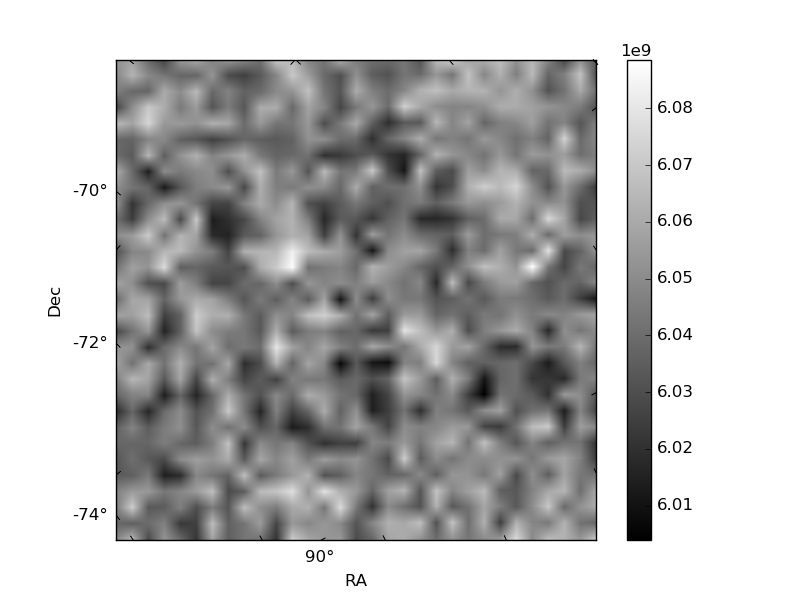
Histogram calculated using DETX and DETY for each event in the final _common_clean file
| Quadrant A |  |
 |
Quadrant B |
|---|---|---|---|
| Quadrant D |  |
 |
Quadrant C |
| Plot type | Count rate plots | Images |
|---|---|---|
| Comparison with Poisson distribution Blue bars denote a histogram of data divided into 1 sec bins. Red curve is a Poisson curve with rate = median count rate of data. |
 |
 |
| Quadrant-wise count rates Data is divided into 100 sec bins |
 |
|
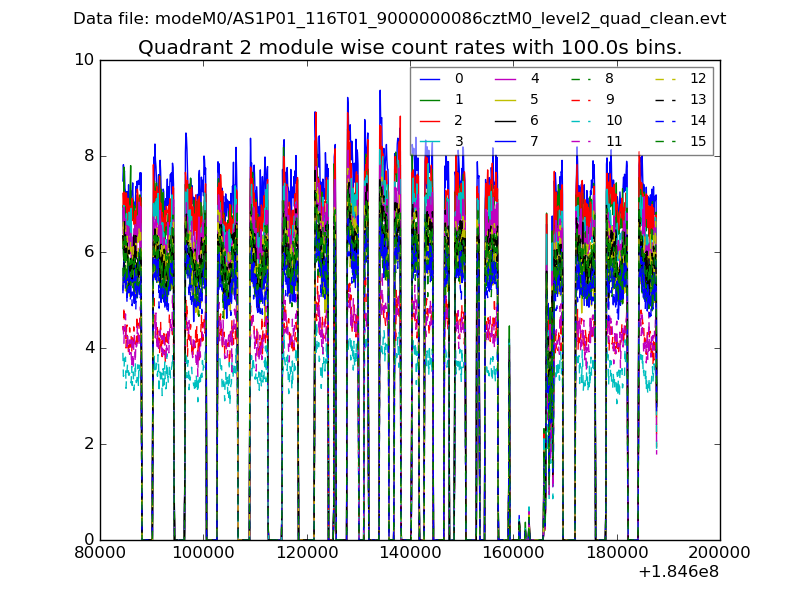
| Module-wise count rates for Quadrant A Data is divided into 100 sec bins |
 |
 |
| Module-wise count rates for Quadrant B Data is divided into 100 sec bins |
 |
 |
| Module-wise count rates for Quadrant C Data is divided into 100 sec bins |
 |
 |
| Module-wise count rates for Quadrant D Data is divided into 100 sec bins |
 |
 |
| Parameter | Plot |
|---|---|
| CZT HV Monitor |  |
| D_VDD | 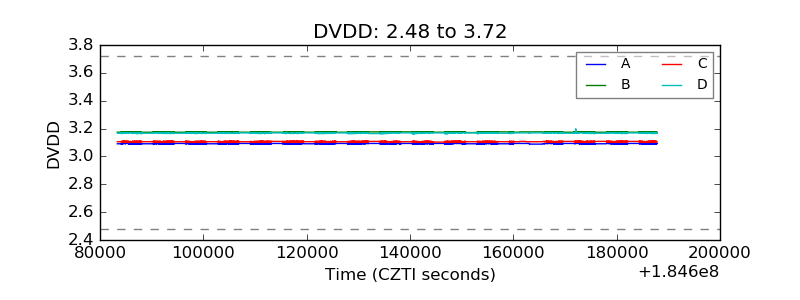 |
| Temperature 1 |  |
| Veto HV Monitor |  |
| Veto LLD |  |
| Alpha Counter |  |
| _CPM_Rate |  |
| CZT Counter |  |
| +2.5 Volts monitor |  |
| +5 Volts monitor |  |
| _ROLL_ROT | 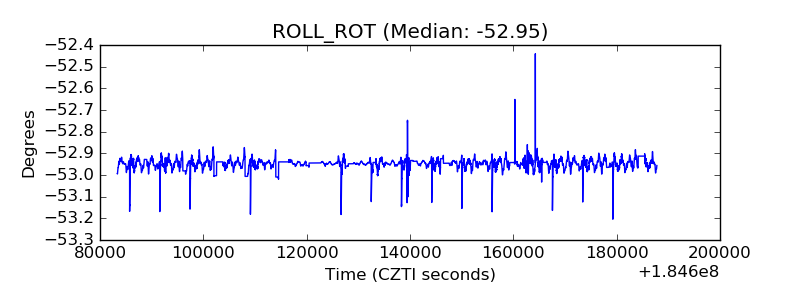 |
| _Roll_DEC | 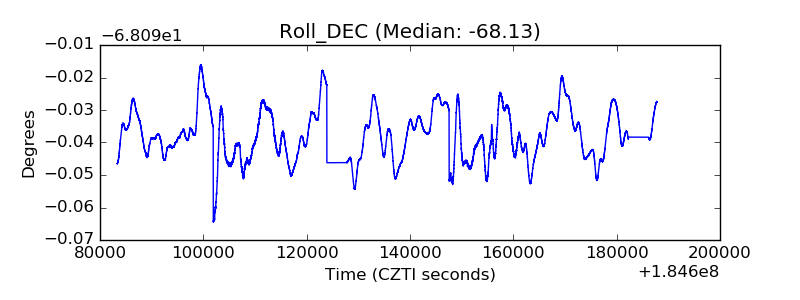 |
| _Roll_RA |  |
| Veto Counter |  |