| Param | Original file | Final file |
|---|---|---|
| Filename | modeM0/AS1P01_126T01_9000000084cztM0_level2_bc.evt | modeM0/AS1P01_126T01_9000000084cztM0_level2_quad_clean.evt |
| Size (bytes) | 2,667,784,320 | 904,527,360 |
| Size | 2.5 GB | 862.6 MB |
| Events in quadrant A | 18,567,612 | 5,562,745 |
| Events in quadrant B | 16,854,898 | 5,684,582 |
| Events in quadrant C | 14,730,934 | 5,610,080 |
| Events in quadrant D | 25,535,761 | 5,401,234 |
| Mode SS | |||
|---|---|---|---|
| Quadrant | BADHDUFLAG | Total packets | Discarded packets |
| A | 0 | 1532 | 0 |
| B | 0 | 1532 | 0 |
| C | 0 | 1532 | 0 |
| D | 0 | 1532 | 0 |
| Mode M0 | |||
|---|---|---|---|
| Quadrant | BADHDUFLAG | Total packets | Discarded packets |
| A | 0 | 331805 | 0 |
| B | 0 | 324937 | 0 |
| C | 0 | 296907 | 0 |
| D | 0 | 322371 | 0 |
| Mode M9 | |||
|---|---|---|---|
| Quadrant | BADHDUFLAG | Total packets | Discarded packets |
| A | 0 | 379 | 0 |
| B | 0 | 379 | 0 |
| C | 0 | 379 | 0 |
| D | 0 | 381 | 0 |
| Quadrant | Total seconds | Saturated seconds | Saturation percentage |
|---|---|---|---|
| A | 74953 | 1042 | 1.390205% |
| B | 74953 | 331 | 0.441610% |
| C | 74953 | 105 | 0.140088% |
| D | 74953 | 1284 | 1.713074% |
Noise dominated data is calculated using 1-second bins in cleaned event files. If a bin has >2000 counts, and if more than 50% of those come from <1% of pixels, then it is considered to be noise-dominated and hence unusable.
| Quadrant | # 1 sec bins | Bins with >0 counts | Bins with >2000 counts | High rate bins dominated by noise | Noise dominated (total time) | Noise dominated (detector-on time) | Marked lightcurve |
|---|---|---|---|---|---|---|---|
| A | 117003 | 74953 | 429 | 429 | 0.37% | 0.57% |  |
| B | 117003 | 74953 | 99 | 99 | 0.08% | 0.13% |  |
| C | 117003 | 74952 | 34 | 34 | 0.03% | 0.05% |  |
| D | 117003 | 74951 | 613 | 613 | 0.52% | 0.82% |  |
Top three noisy pixels from each quadrant. If the there are fewer than three noisy pixels in the level2.evt file, extra rows are filled as -1
| Pixel properties | Quadrant properties | ||||||
|---|---|---|---|---|---|---|---|
| Quadrant | DetID | PixID | Counts | Sigma | Mean | Median | Sigma |
| A | 15 | 200 | 2748538 | 4259.04 | 3102 | 3037 | 644.6 |
| A | 15 | 171 | 782673 | 1209.43 | 3102 | 3037 | 644.6 |
| A | 0 | 149 | 676042 | 1044.02 | 3102 | 3037 | 644.6 |
| B | 7 | 221 | 1848507 | 3231.13 | 3211 | 3116 | 571.1 |
| B | 5 | 191 | 645774 | 1125.24 | 3211 | 3116 | 571.1 |
| B | 4 | 250 | 609539 | 1061.8 | 3211 | 3116 | 571.1 |
| C | 15 | 241 | 564206 | 849.11 | 3123 | 3067 | 660.9 |
| C | 9 | 83 | 545925 | 821.45 | 3123 | 3067 | 660.9 |
| C | 1 | 1 | 513402 | 772.23 | 3123 | 3067 | 660.9 |
| D | 12 | 237 | 3418878 | 4984.63 | 3071 | 2982 | 685.3 |
| D | 1 | 4 | 2933791 | 4276.77 | 3071 | 2982 | 685.3 |
| D | 13 | 221 | 1515636 | 2207.33 | 3071 | 2982 | 685.3 |
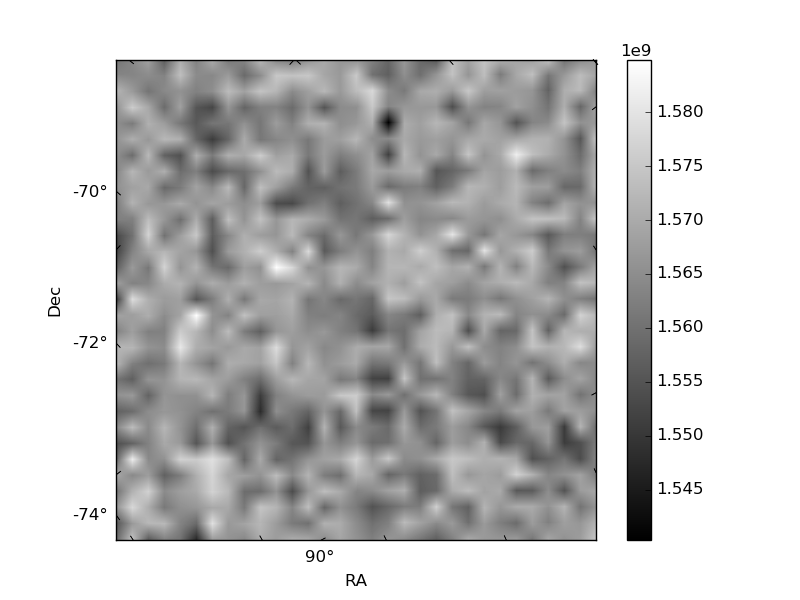
Histogram calculated using DETX and DETY for each event in the final _common_clean file
| Quadrant A |  |
 |
Quadrant B |
|---|---|---|---|
| Quadrant D |  |
 |
Quadrant C |
| Plot type | Count rate plots | Images |
|---|---|---|
| Comparison with Poisson distribution Blue bars denote a histogram of data divided into 1 sec bins. Red curve is a Poisson curve with rate = median count rate of data. |
 |
 |
| Quadrant-wise count rates Data is divided into 100 sec bins |
 |
|
| Module-wise count rates for Quadrant A Data is divided into 100 sec bins |
 |
 |
| Module-wise count rates for Quadrant B Data is divided into 100 sec bins |
 |
 |
| Module-wise count rates for Quadrant C Data is divided into 100 sec bins |
 |
 |
| Module-wise count rates for Quadrant D Data is divided into 100 sec bins |
 |
 |
| Parameter | Plot |
|---|---|
| CZT HV Monitor |  |
| D_VDD |  |
| Temperature 1 |  |
| Veto HV Monitor | 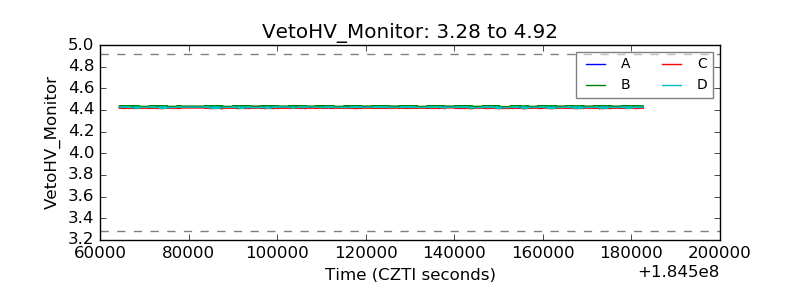 |
| Veto LLD |  |
| Alpha Counter | 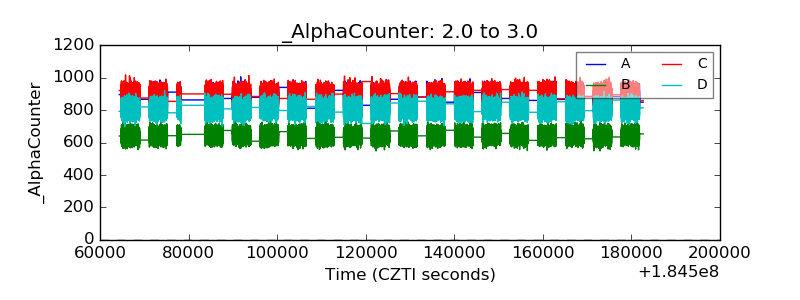 |
| _CPM_Rate |  |
| CZT Counter |  |
| +2.5 Volts monitor | 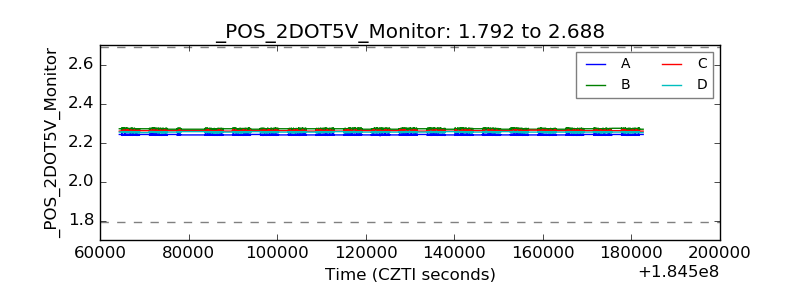 |
| +5 Volts monitor |  |
| Veto Counter |  |