| Param | Original file | Final file |
|---|---|---|
| Filename | modeM0/AS1P01_118T02_9000000082cztM0_level2_bc.evt | modeM0/AS1P01_118T02_9000000082cztM0_level2_quad_clean.evt |
| Size (bytes) | 1,840,714,560 | 527,633,280 |
| Size | 1.7 GB | 503.2 MB |
| Events in quadrant A | 11,094,022 | 3,096,531 |
| Events in quadrant B | 12,083,983 | 3,130,721 |
| Events in quadrant C | 10,524,295 | 3,105,279 |
| Events in quadrant D | 18,384,322 | 2,965,246 |
| Mode SS | |||
|---|---|---|---|
| Quadrant | BADHDUFLAG | Total packets | Discarded packets |
| A | 0 | 1098 | 0 |
| B | 0 | 1098 | 0 |
| C | 0 | 1098 | 0 |
| D | 0 | 1098 | 0 |
| Mode M0 | |||
|---|---|---|---|
| Quadrant | BADHDUFLAG | Total packets | Discarded packets |
| A | 0 | 230280 | 0 |
| B | 0 | 232201 | 0 |
| C | 0 | 212771 | 0 |
| D | 0 | 234105 | 0 |
| Mode M9 | |||
|---|---|---|---|
| Quadrant | BADHDUFLAG | Total packets | Discarded packets |
| A | 0 | 276 | 0 |
| B | 0 | 276 | 0 |
| C | 0 | 276 | 0 |
| D | 0 | 276 | 0 |
| Quadrant | Total seconds | Saturated seconds | Saturation percentage |
|---|---|---|---|
| A | 53672 | 477 | 0.888732% |
| B | 53679 | 223 | 0.415432% |
| C | 53670 | 187 | 0.348426% |
| D | 53674 | 1181 | 2.200320% |
Noise dominated data is calculated using 1-second bins in cleaned event files. If a bin has >2000 counts, and if more than 50% of those come from <1% of pixels, then it is considered to be noise-dominated and hence unusable.
| Quadrant | # 1 sec bins | Bins with >0 counts | Bins with >2000 counts | High rate bins dominated by noise | Noise dominated (total time) | Noise dominated (detector-on time) | Marked lightcurve |
|---|---|---|---|---|---|---|---|
| A | 79384 | 53685 | 97 | 97 | 0.12% | 0.18% | 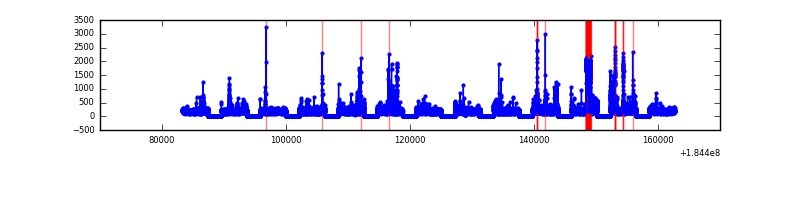 |
| B | 79384 | 53688 | 28 | 28 | 0.04% | 0.05% |  |
| C | 79384 | 53684 | 77 | 77 | 0.10% | 0.14% | 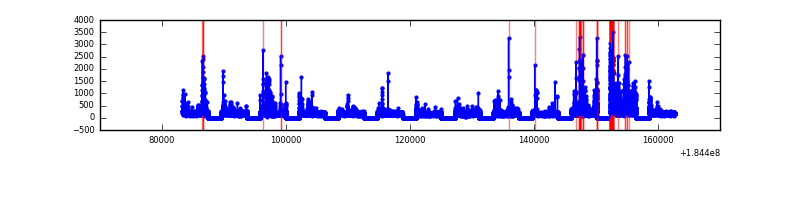 |
| D | 79384 | 53676 | 405 | 405 | 0.51% | 0.75% | 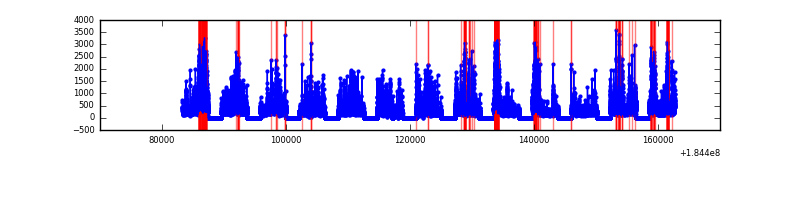 |
Top three noisy pixels from each quadrant. If the there are fewer than three noisy pixels in the level2.evt file, extra rows are filled as -1
| Pixel properties | Quadrant properties | ||||||
|---|---|---|---|---|---|---|---|
| Quadrant | DetID | PixID | Counts | Sigma | Mean | Median | Sigma |
| A | 15 | 17 | 1070926 | 2261.33 | 2262 | 2206 | 472.6 |
| A | 13 | 160 | 229042 | 479.97 | 2262 | 2206 | 472.6 |
| A | 0 | 149 | 213649 | 447.4 | 2262 | 2206 | 472.6 |
| B | 7 | 221 | 935777 | 2289.34 | 2322 | 2251 | 407.8 |
| B | 4 | 250 | 773774 | 1892.05 | 2322 | 2251 | 407.8 |
| B | 4 | 206 | 443563 | 1082.26 | 2322 | 2251 | 407.8 |
| C | 3 | 159 | 896898 | 1898.63 | 2248 | 2206 | 471.2 |
| C | 1 | 1 | 240669 | 506.04 | 2248 | 2206 | 471.2 |
| C | 15 | 241 | 237900 | 500.17 | 2248 | 2206 | 471.2 |
| D | 1 | 4 | 3527529 | 7288.48 | 2211 | 2150 | 483.7 |
| D | 13 | 216 | 1250488 | 2580.85 | 2211 | 2150 | 483.7 |
| D | 12 | 237 | 1056114 | 2179.0 | 2211 | 2150 | 483.7 |
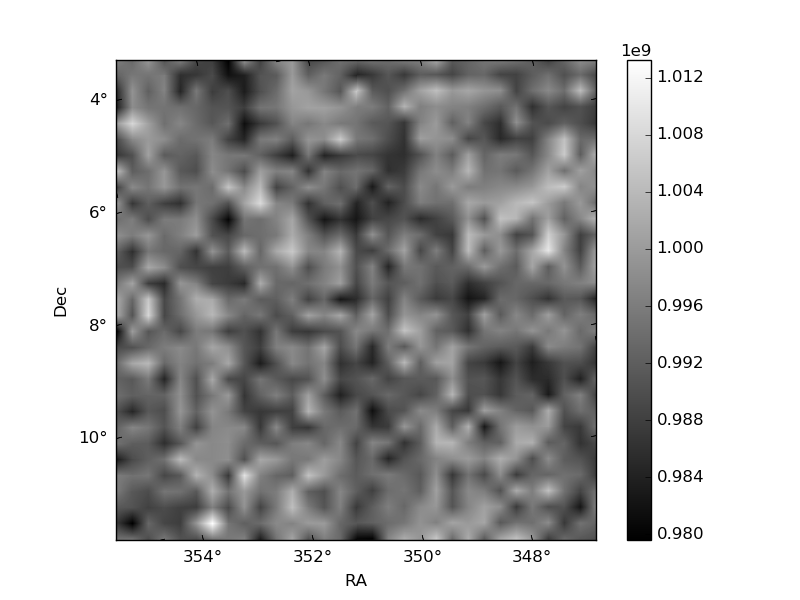
Histogram calculated using DETX and DETY for each event in the final _common_clean file
| Quadrant A | 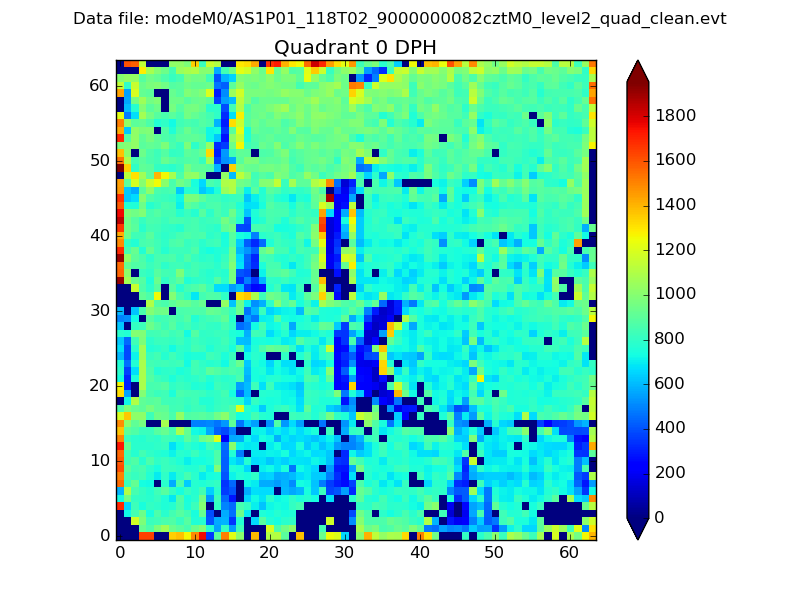 |
 |
Quadrant B |
|---|---|---|---|
| Quadrant D |  |
 |
Quadrant C |
| Plot type | Count rate plots | Images |
|---|---|---|
| Comparison with Poisson distribution Blue bars denote a histogram of data divided into 1 sec bins. Red curve is a Poisson curve with rate = median count rate of data. |
 |
 |
| Quadrant-wise count rates Data is divided into 100 sec bins |
 |
|
| Module-wise count rates for Quadrant A Data is divided into 100 sec bins |
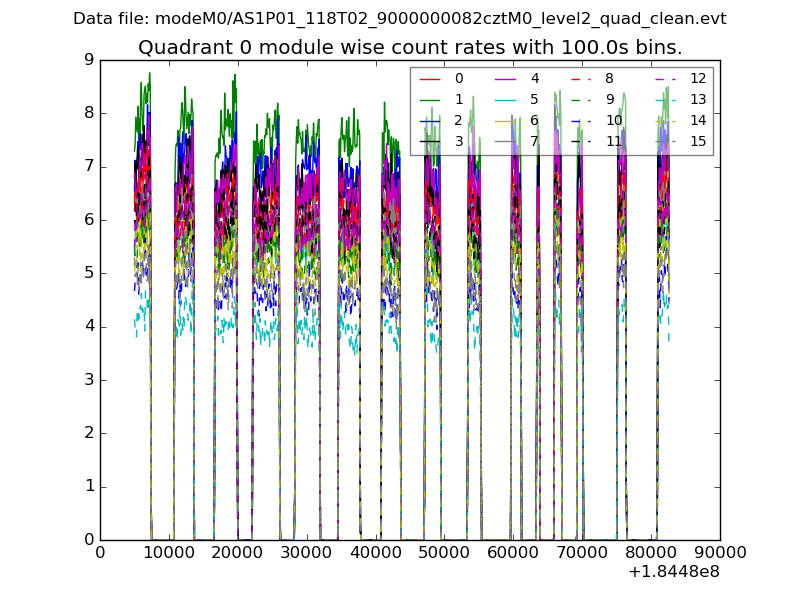 |
 |
| Module-wise count rates for Quadrant B Data is divided into 100 sec bins |
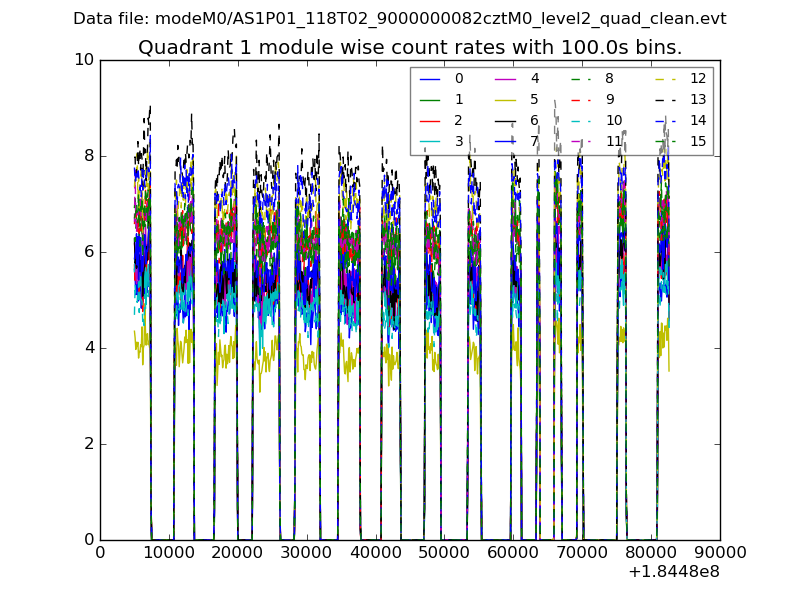 |
 |
| Module-wise count rates for Quadrant C Data is divided into 100 sec bins |
 |
 |
| Module-wise count rates for Quadrant D Data is divided into 100 sec bins |
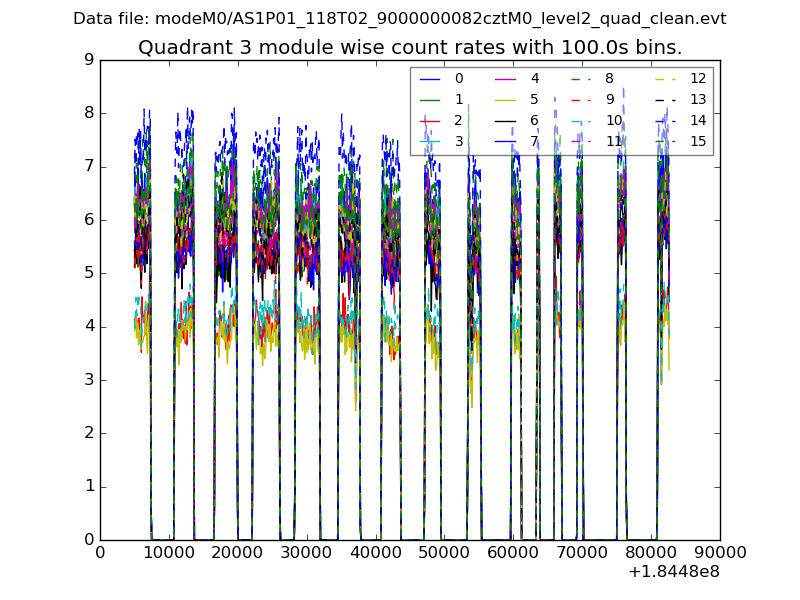 |
 |
| Parameter | Plot |
|---|---|
| CZT HV Monitor |  |
| D_VDD |  |
| Temperature 1 |  |
| Veto HV Monitor |  |
| Veto LLD | 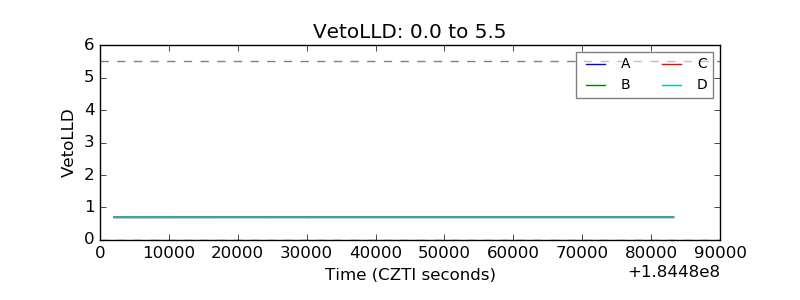 |
| Alpha Counter | 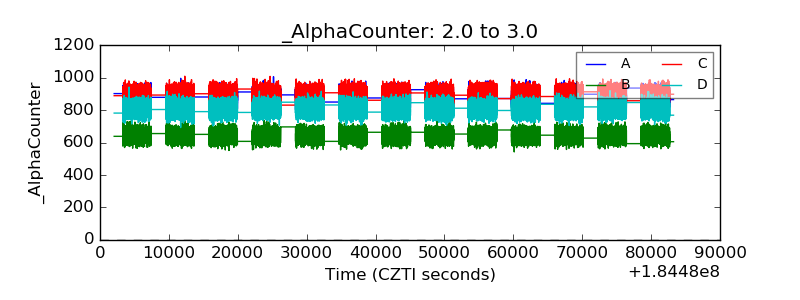 |
| _CPM_Rate |  |
| CZT Counter |  |
| +2.5 Volts monitor |  |
| +5 Volts monitor | 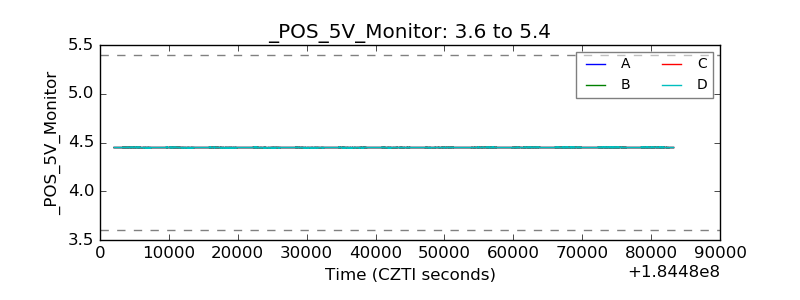 |
| _ROLL_ROT | 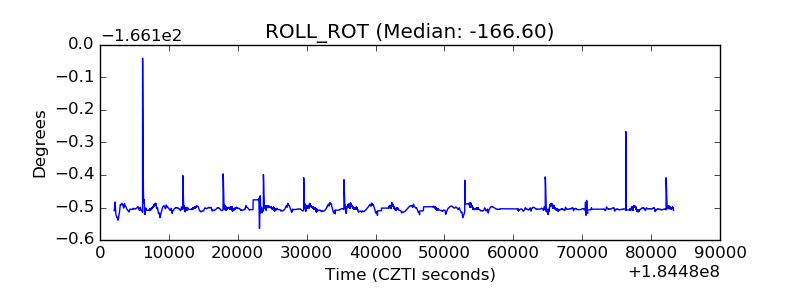 |
| _Roll_DEC | 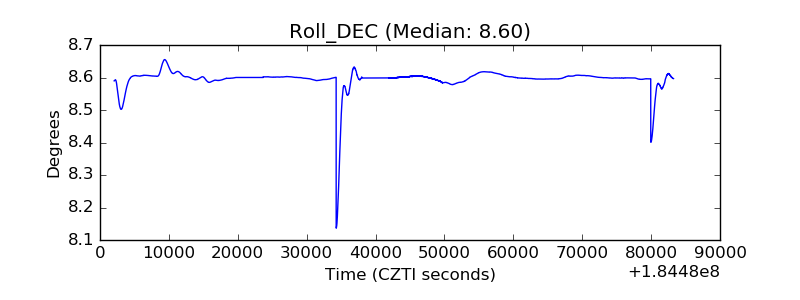 |
| _Roll_RA |  |
| Veto Counter |  |