| Param | Original file | Final file |
|---|---|---|
| Filename | modeM0/AS1P01_014T06_9000000078cztM0_level2_bc.evt | modeM0/AS1P01_014T06_9000000078cztM0_level2_quad_clean.evt |
| Size (bytes) | 818,199,360 | 289,422,720 |
| Size | 780.3 MB | 276.0 MB |
| Events in quadrant A | 4,952,989 | 1,832,356 |
| Events in quadrant B | 5,153,747 | 1,858,294 |
| Events in quadrant C | 4,031,361 | 1,822,680 |
| Events in quadrant D | 9,129,415 | 1,730,711 |
| Mode SS | |||
|---|---|---|---|
| Quadrant | BADHDUFLAG | Total packets | Discarded packets |
| A | 0 | 454 | 0 |
| B | 0 | 454 | 0 |
| C | 0 | 454 | 0 |
| D | 0 | 454 | 0 |
| Mode M0 | |||
|---|---|---|---|
| Quadrant | BADHDUFLAG | Total packets | Discarded packets |
| A | 0 | 96212 | 0 |
| B | 0 | 95294 | 0 |
| C | 0 | 86412 | 0 |
| D | 0 | 101895 | 0 |
| Mode M9 | |||
|---|---|---|---|
| Quadrant | BADHDUFLAG | Total packets | Discarded packets |
| A | 0 | 130 | 0 |
| B | 0 | 130 | 0 |
| C | 0 | 130 | 0 |
| D | 0 | 130 | 0 |
| Quadrant | Total seconds | Saturated seconds | Saturation percentage |
|---|---|---|---|
| A | 22116 | 191 | 0.863628% |
| B | 22116 | 43 | 0.194429% |
| C | 22116 | 9 | 0.040695% |
| D | 22116 | 512 | 2.315066% |
Noise dominated data is calculated using 1-second bins in cleaned event files. If a bin has >2000 counts, and if more than 50% of those come from <1% of pixels, then it is considered to be noise-dominated and hence unusable.
| Quadrant | # 1 sec bins | Bins with >0 counts | Bins with >2000 counts | High rate bins dominated by noise | Noise dominated (total time) | Noise dominated (detector-on time) | Marked lightcurve |
|---|---|---|---|---|---|---|---|
| A | 35051 | 22116 | 139 | 139 | 0.40% | 0.63% |  |
| B | 35051 | 22116 | 6 | 6 | 0.02% | 0.03% |  |
| C | 35051 | 22116 | 0 | 0 | 0.00% | 0.00% | 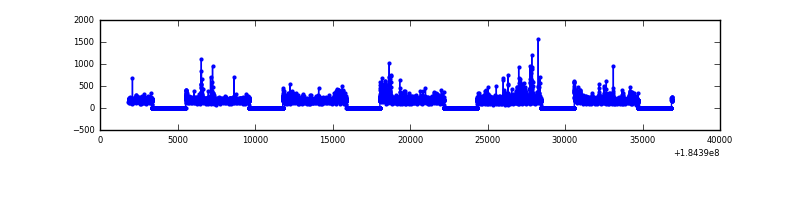 |
| D | 35051 | 22116 | 183 | 183 | 0.52% | 0.83% | 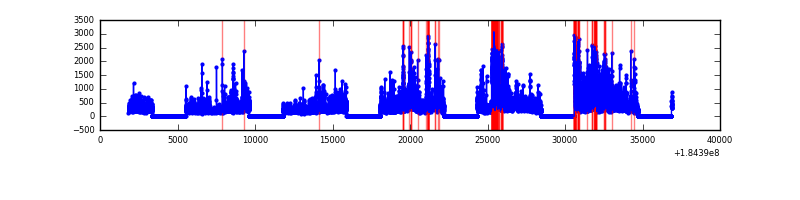 |
Top three noisy pixels from each quadrant. If the there are fewer than three noisy pixels in the level2.evt file, extra rows are filled as -1
| Pixel properties | Quadrant properties | ||||||
|---|---|---|---|---|---|---|---|
| Quadrant | DetID | PixID | Counts | Sigma | Mean | Median | Sigma |
| A | 0 | 149 | 449480 | 2230.85 | 948 | 928 | 201.1 |
| A | 0 | 238 | 336480 | 1668.85 | 948 | 928 | 201.1 |
| A | 15 | 143 | 150421 | 743.5 | 948 | 928 | 201.1 |
| B | 4 | 250 | 688048 | 3980.61 | 975 | 947 | 172.6 |
| B | 8 | 4 | 80950 | 463.48 | 975 | 947 | 172.6 |
| B | 4 | 235 | 74001 | 423.23 | 975 | 947 | 172.6 |
| C | 5 | 249 | 173949 | 869.47 | 939 | 924 | 199.0 |
| C | 15 | 241 | 59074 | 292.21 | 939 | 924 | 199.0 |
| C | 3 | 159 | 24388 | 117.91 | 939 | 924 | 199.0 |
| D | 12 | 237 | 1242819 | 6149.61 | 922 | 897 | 202.0 |
| D | 1 | 4 | 854760 | 4228.06 | 922 | 897 | 202.0 |
| D | 9 | 52 | 671124 | 3318.75 | 922 | 897 | 202.0 |
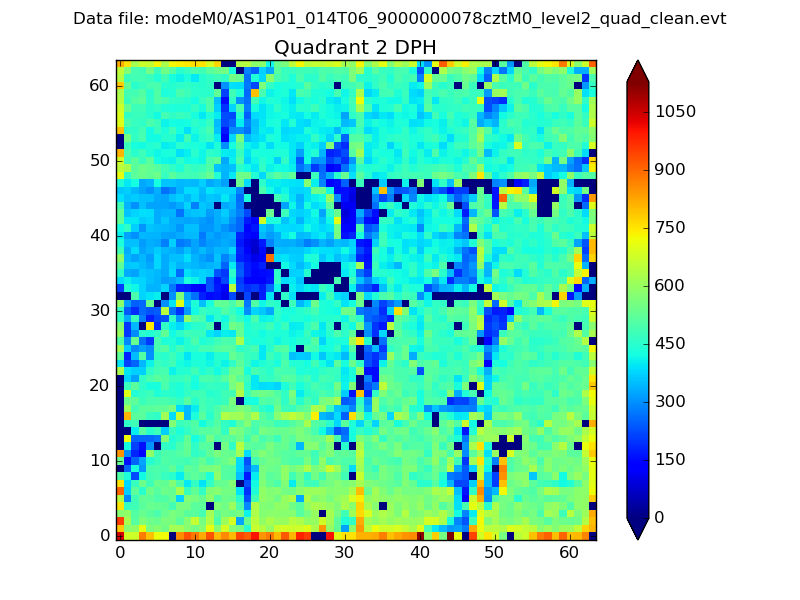
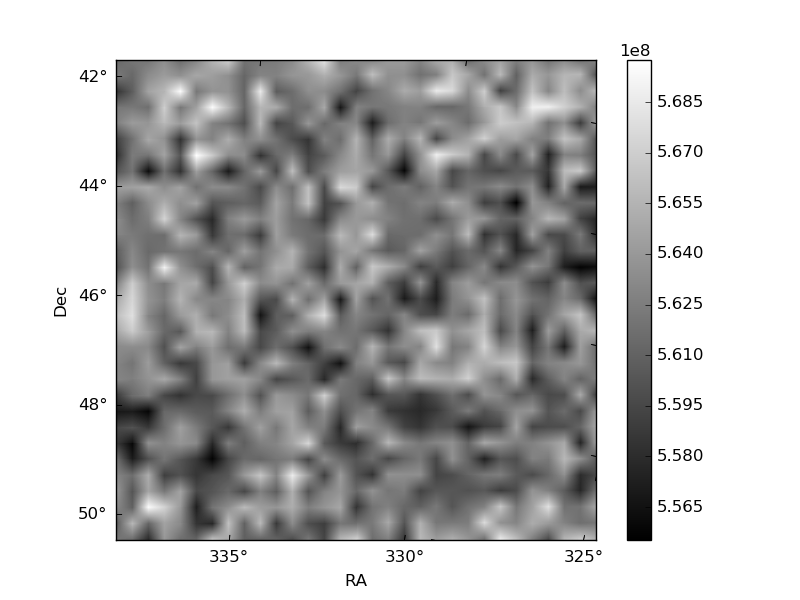
Histogram calculated using DETX and DETY for each event in the final _common_clean file
| Quadrant A |  |
 |
Quadrant B |
|---|---|---|---|
| Quadrant D | 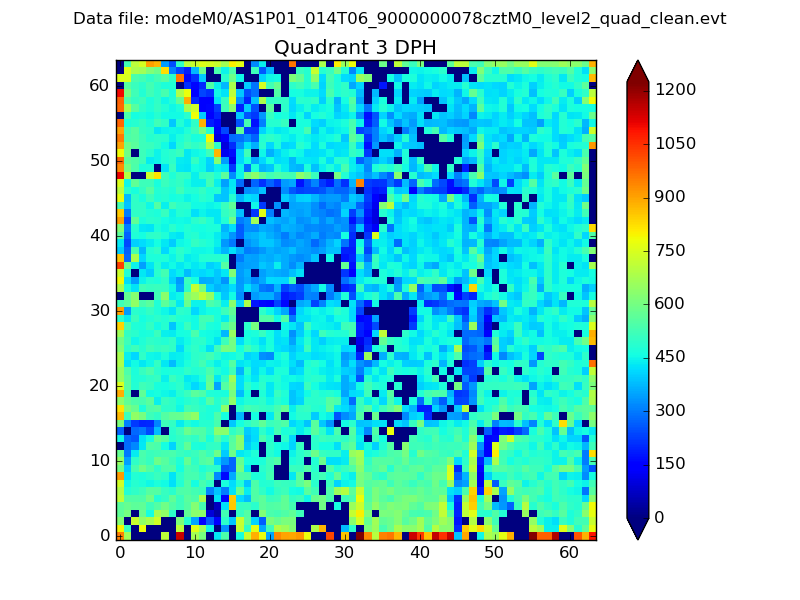 |
 |
Quadrant C |
| Plot type | Count rate plots | Images |
|---|---|---|
| Comparison with Poisson distribution Blue bars denote a histogram of data divided into 1 sec bins. Red curve is a Poisson curve with rate = median count rate of data. |
 |
 |
| Quadrant-wise count rates Data is divided into 100 sec bins |
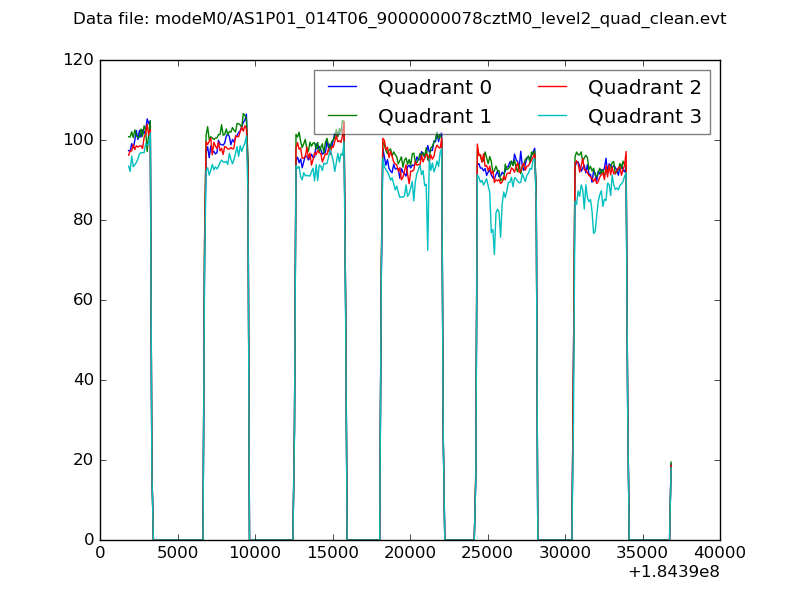 |
|
| Module-wise count rates for Quadrant A Data is divided into 100 sec bins |
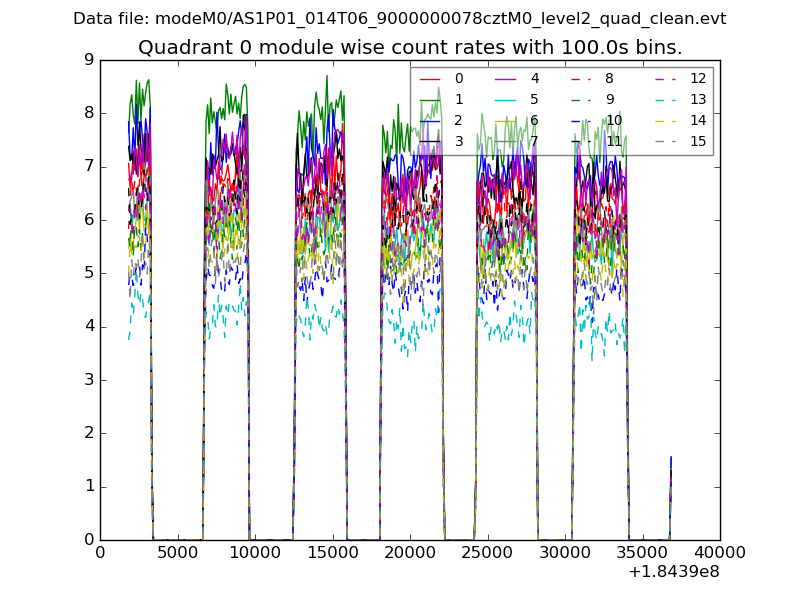 |
 |
| Module-wise count rates for Quadrant B Data is divided into 100 sec bins |
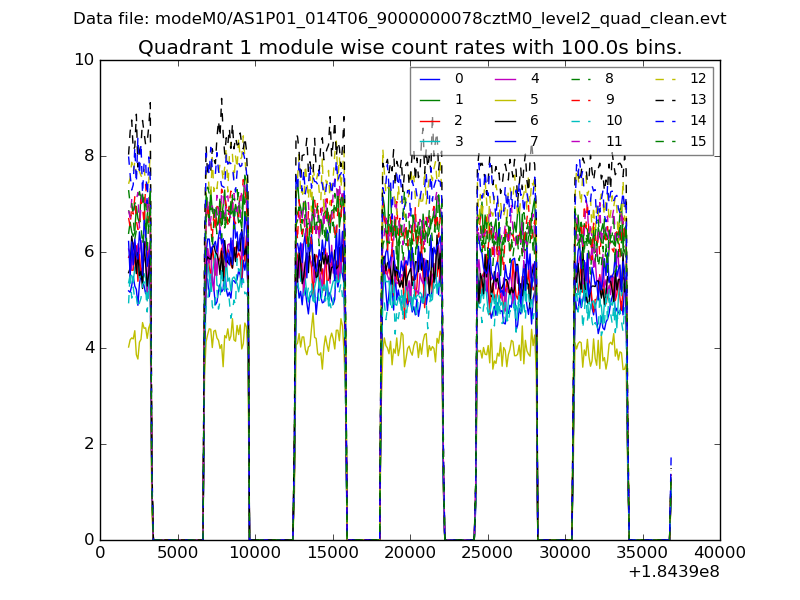 |
 |
| Module-wise count rates for Quadrant C Data is divided into 100 sec bins |
 |
 |
| Module-wise count rates for Quadrant D Data is divided into 100 sec bins |
 |
 |
| Parameter | Plot |
|---|---|
| CZT HV Monitor | 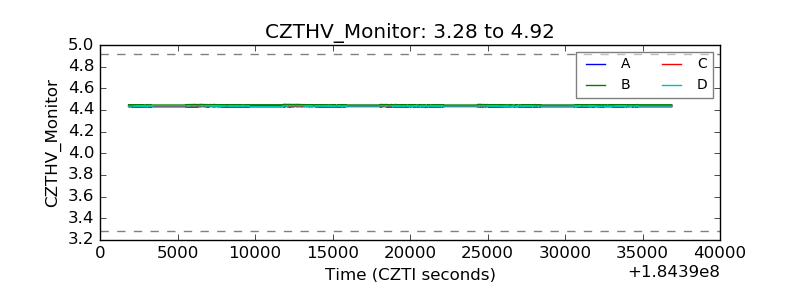 |
| D_VDD |  |
| Temperature 1 |  |
| Veto HV Monitor |  |
| Veto LLD |  |
| Alpha Counter |  |
| _CPM_Rate |  |
| CZT Counter |  |
| +2.5 Volts monitor | 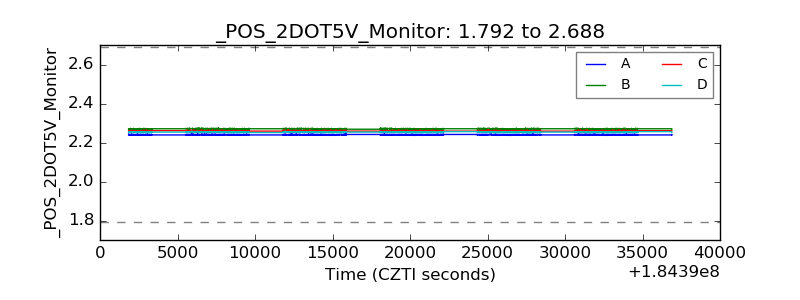 |
| +5 Volts monitor |  |
| _ROLL_ROT |  |
| _Roll_DEC |  |
| _Roll_RA | 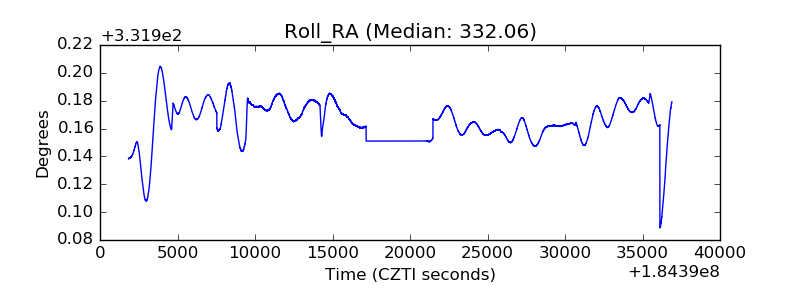 |
| Veto Counter |  |