| Param | Original file | Final file |
|---|---|---|
| Filename | modeM0/AS1P01_014T01_9000000080cztM0_level2_bc.evt | modeM0/AS1P01_014T01_9000000080cztM0_level2_quad_clean.evt |
| Size (bytes) | 1,309,933,440 | 491,512,320 |
| Size | 1.2 GB | 468.7 MB |
| Events in quadrant A | 10,104,069 | 3,096,992 |
| Events in quadrant B | 7,348,972 | 3,142,945 |
| Events in quadrant C | 7,883,840 | 3,122,393 |
| Events in quadrant D | 11,844,078 | 3,019,021 |
| Mode SS | |||
|---|---|---|---|
| Quadrant | BADHDUFLAG | Total packets | Discarded packets |
| A | 0 | 748 | 0 |
| B | 0 | 748 | 0 |
| C | 0 | 748 | 0 |
| D | 0 | 748 | 0 |
| Mode M9 | |||
|---|---|---|---|
| Quadrant | BADHDUFLAG | Total packets | Discarded packets |
| A | 0 | 173 | 0 |
| B | 0 | 173 | 0 |
| C | 0 | 173 | 0 |
| D | 0 | 173 | 0 |
| Mode M0 | |||
|---|---|---|---|
| Quadrant | BADHDUFLAG | Total packets | Discarded packets |
| A | 0 | 163110 | 0 |
| B | 0 | 152865 | 0 |
| C | 0 | 146336 | 0 |
| D | 0 | 154570 | 0 |
| Quadrant | Total seconds | Saturated seconds | Saturation percentage |
|---|---|---|---|
| A | 36485 | 1280 | 3.508291% |
| B | 36485 | 76 | 0.208305% |
| C | 36485 | 573 | 1.570508% |
| D | 36485 | 490 | 1.343018% |
Noise dominated data is calculated using 1-second bins in cleaned event files. If a bin has >2000 counts, and if more than 50% of those come from <1% of pixels, then it is considered to be noise-dominated and hence unusable.
| Quadrant | # 1 sec bins | Bins with >0 counts | Bins with >2000 counts | High rate bins dominated by noise | Noise dominated (total time) | Noise dominated (detector-on time) | Marked lightcurve |
|---|---|---|---|---|---|---|---|
| A | 53728 | 36486 | 494 | 494 | 0.92% | 1.35% |  |
| B | 53728 | 36485 | 22 | 22 | 0.04% | 0.06% |  |
| C | 53728 | 36485 | 212 | 212 | 0.39% | 0.58% |  |
| D | 53728 | 36485 | 100 | 100 | 0.19% | 0.27% |  |
Top three noisy pixels from each quadrant. If the there are fewer than three noisy pixels in the level2.evt file, extra rows are filled as -1
| Pixel properties | Quadrant properties | ||||||
|---|---|---|---|---|---|---|---|
| Quadrant | DetID | PixID | Counts | Sigma | Mean | Median | Sigma |
| A | 0 | 149 | 3036021 | 9580.62 | 1507 | 1475 | 316.7 |
| A | 13 | 17 | 492400 | 1549.94 | 1507 | 1475 | 316.7 |
| A | 0 | 238 | 274138 | 860.85 | 1507 | 1475 | 316.7 |
| B | 5 | 251 | 231462 | 839.59 | 1558 | 1514 | 273.9 |
| B | 4 | 250 | 167723 | 606.87 | 1558 | 1514 | 273.9 |
| B | 8 | 4 | 163006 | 589.64 | 1558 | 1514 | 273.9 |
| C | 15 | 241 | 1222316 | 3794.32 | 1509 | 1488 | 321.8 |
| C | 9 | 85 | 196205 | 605.18 | 1509 | 1488 | 321.8 |
| C | 5 | 249 | 192045 | 592.25 | 1509 | 1488 | 321.8 |
| D | 1 | 4 | 2409283 | 7352.57 | 1492 | 1454 | 327.5 |
| D | 13 | 216 | 695492 | 2119.32 | 1492 | 1454 | 327.5 |
| D | 13 | 221 | 666597 | 2031.09 | 1492 | 1454 | 327.5 |
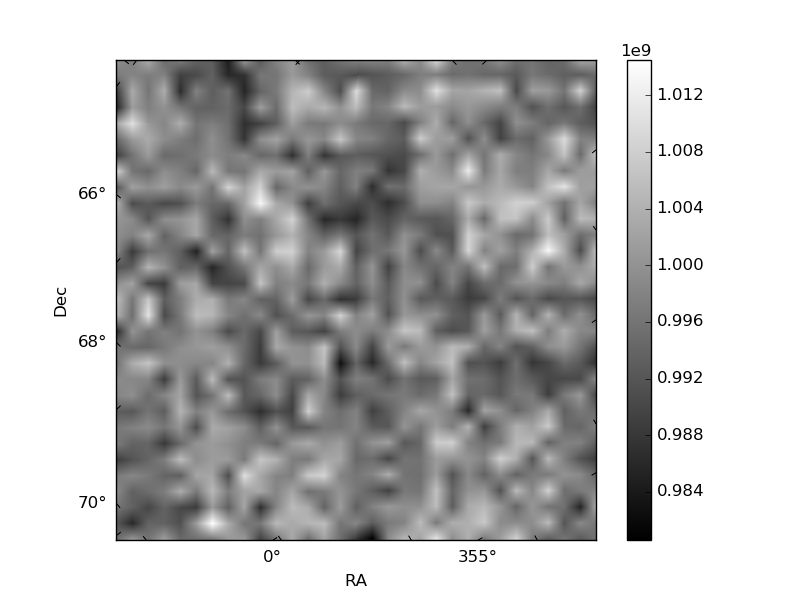
Histogram calculated using DETX and DETY for each event in the final _common_clean file
| Quadrant A | 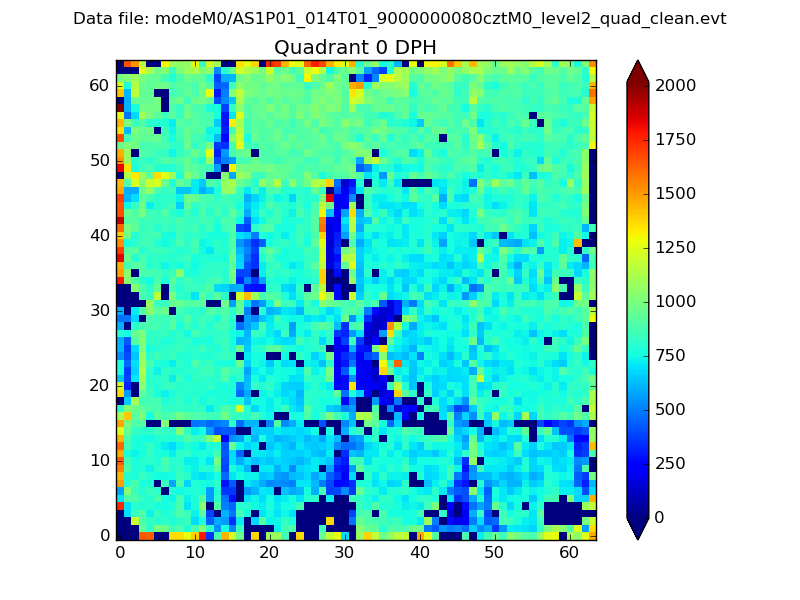 |
 |
Quadrant B |
|---|---|---|---|
| Quadrant D |  |
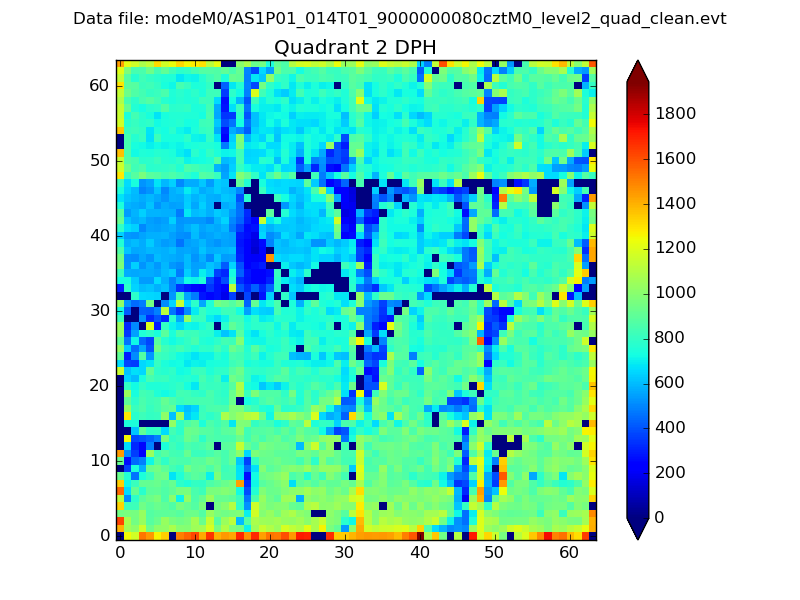 |
Quadrant C |
| Plot type | Count rate plots | Images |
|---|---|---|
| Comparison with Poisson distribution Blue bars denote a histogram of data divided into 1 sec bins. Red curve is a Poisson curve with rate = median count rate of data. |
 |
 |
| Quadrant-wise count rates Data is divided into 100 sec bins |
 |
|
| Module-wise count rates for Quadrant A Data is divided into 100 sec bins |
 |
 |
| Module-wise count rates for Quadrant B Data is divided into 100 sec bins |
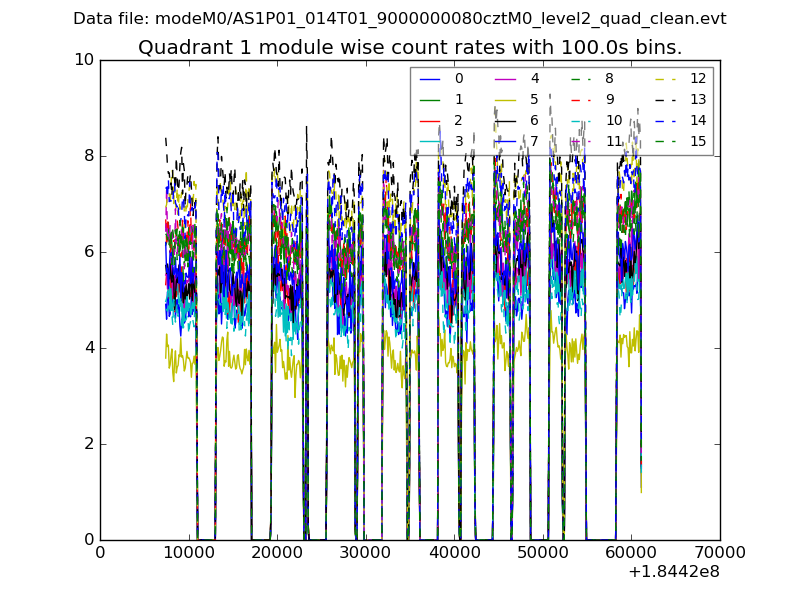 |
 |
| Module-wise count rates for Quadrant C Data is divided into 100 sec bins |
 |
 |
| Module-wise count rates for Quadrant D Data is divided into 100 sec bins |
 |
 |
| Parameter | Plot |
|---|---|
| CZT HV Monitor |  |
| D_VDD |  |
| Temperature 1 |  |
| Veto HV Monitor | 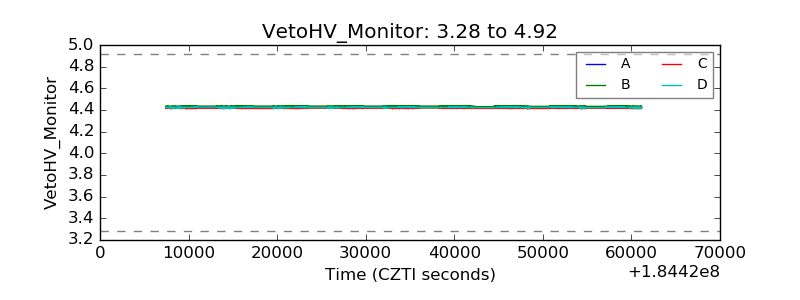 |
| Veto LLD |  |
| Alpha Counter | 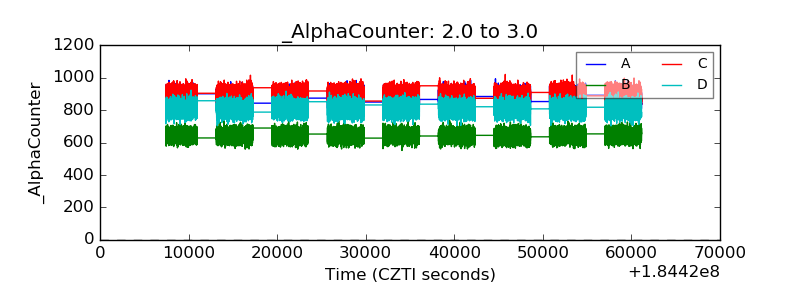 |
| _CPM_Rate | 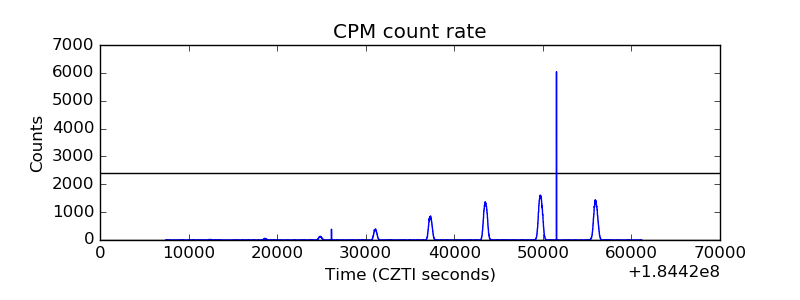 |
| CZT Counter |  |
| +2.5 Volts monitor |  |
| +5 Volts monitor |  |
| _ROLL_ROT |  |
| _Roll_DEC |  |
| _Roll_RA |  |
| Veto Counter | 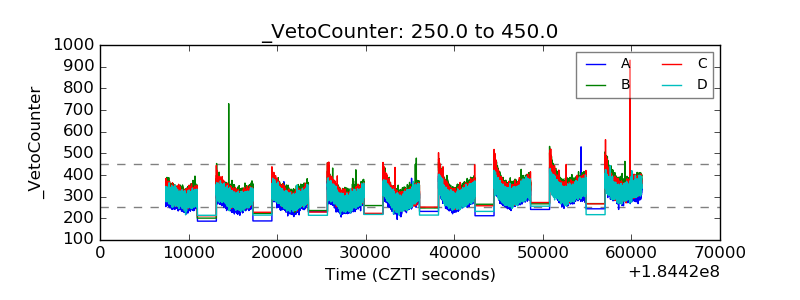 |